REPORT: DAL Cowboys Micah Parsons Versatility, Positional Traits, Game Planning, and Development
Example report for Micah Parsons from Weeks 1-8, 2021
The following report uses 2023 Big Data Bowl data on pass plays from Weeks 1-8 of the 2021 season. I use my team’s Big Data Bowl Finalist project for the Coaching Track to help analyze Micah Parsons’ versatility as a defender. The project can be read here for further explanation. Additionally, I use my latest created metric Pass Rusher Momentum to analyze a pass rusher’s raw power generated on one-on-one pass rushes and quantified ‘get-off’ as a pass rusher’s max speed within 0.5 seconds of the snap.
Feel free to skip this next part about communicating information to coaches and executives and go right to the report section. The report will be broken down into segments for easier readability. The report is composed of different types of information that may be resourceful to coaches, executives, and players.
Note: Parsons has become more of an EDGE than Off-Ball LB like he was used on a majority of snaps in Weeks 1-8 of 2021. This off-season Parsons stated that he’s bulking up for a position change, but Dan Quinn said Parsons will not be changing positions.
Explaining & Synthesizing Complex Information
The goal of this report is to showcase how I would communicate complex information to a non-technical audience.
If I were to obtain a position with an NFL club I would ask the coaches and front office executives how they like to consume information. If given the opportunity to ask questions in job interviews with coaches and front office executives I often ask how stakeholders like to take in information. That way I can stow that information away in case I get the position or worst case I learn how people in those positions think to apply it in the future.
Seahawks Head Coach Pete Carroll once said, “learn your learner”, in regards to how he and his staff coach-up players. Essentially if you’re communicating information to others, you not only need to explain the material thoroughly, but explain the material in terms your audience understands.
Key Takeaways Page
Most coaches and executives are busy and do not have time to read an entire paper on your latest analysis or game report. The first page of your report should be a summary of the most important information. It’s best practice to keep your key takeaways to a page or less and highlight the absolute most important information within that page so it stands out. If a hard copy is warranted, staple the body of work to the back of the key takeaways page or include it in the latter portion of a PDF in case the reader wants to read on and confirm/make sense of your work.
Visuals - Film & Data Viz
A lot of people are visual learners. I myself am a visual learner. Tutorials, reading others code, and consistent practice help me get it in comparison to just the spoken or written word. Coaches and executives are the same way, especially when it comes to a new metric thats short-handed acronym possesses every letter of the alphabet.
Film is the great equalizer to communicating information — no more than a couple plays should be able to get your point across.
Data visuals are also welcome, but they need to be easily interpretable. If a coach has to spend 10 minutes tilting his head sideways to understand your scatterplot it’s time to think up another way to explain your idea.
Defining Metrics
Pass Rush Probability (xPassRush) - the probability a defender rushes the passer based on their pre-snap positioning and movement
Pass Rush Get-Off (MPH) - a player’s max speed in MPH within 0.5 seconds of the snap
Pass Rush Momentum (kg m/s) - a defender’s mass multiplied by their velocity at projected point of contact
Let’s look at an example play as a way of communicating Pass Rush Probability, Raw Power Momentum, and Get-Off Speed metrics to a non-technical audience.
Situation - 3rd Quarter, 9:31 Remaining | 3rd & 11 | DAL 14 LAC 11
Pre-Snap Pass Rush Probability: 88%
Pre-snap Indicators
Distance from LOS - 0.54 yards
Horizontal Distance from Ball - 5.7 yards
Crept Distance - 0.11 yards
Movement Direction - 291.92 degrees
Explanation - The model takes in these inputs and runs them through a position specific model based on where Parsons’ aligns most of his snaps. 88% may seem low, but in this sample of plays Parsons aligned as an Off-Ball LB on a majority of snaps which lowers his probability of rushing compared to if he were to be run through the EDGE model, as LB have more of a chance to drop into coverage.
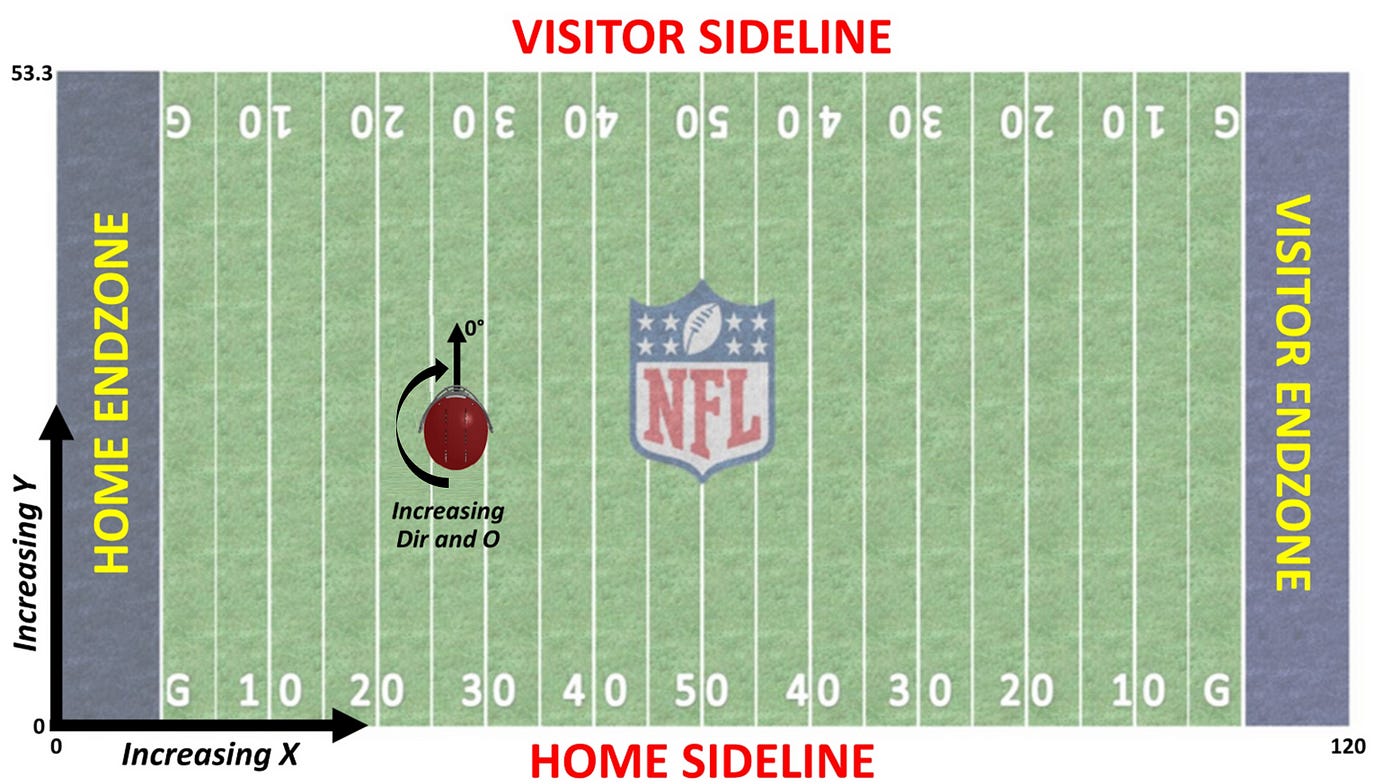
Feature Explanations - Distance from LOS is the vertical distance the defender is from the LOS. Horizontal Distance from Ball is the side to side distance a player is from the ball. Crept Distance is the amount of yards a player walked toward or away from the LOS prior to the snap. Movement Direction is the direction the player’s body is moving prior to the snap in degrees.
To further explain direction, look at the player helmet at the 25-30 yard line in the image below. Zero degrees points straight up toward the top sideline. A direction of 291 degrees would place Parsons’ movement direction to be approximately pointing toward the “ZONE” portion of the words HOME ENDZONE.
Pass Rush Get-Off: 4.91 MPH
This is Parsons’ max speed within a half second after the snap in MPH
Raw Power Pass Rush Momentum: 630 kg m/s
This is Parsons’ max momentum generated on a pass rush in a one-on-one matchup; it is calculated by multiplying player mass by their velocity
Max momentum shows the potential raw power a pass rusher can generate on a single play; variables like alignment and space can impact how much momentum a pass rusher can generate
Micah Parsons Report
Positional Traits (EDGE)
Get-Off Speed - Average Max Speed of 4.80 MPH within 0.5 secs of snap (94th percentile among EDGE)
Max Get-Off Speed - 7.3 MPH
Raw Power - Max Momentum 630 kg m/s (64th percentile among EDGE)
Would be 96th percentile among Off-Ball LB
NOTE: Parsons said he is bulking up this off-season, but wouldn’t bulk up beyond 255 lbs in his career. He indicated that he wanted to increase explosiveness by adding muscle to his frame. Should he reach 255 pounds and maintain his velocity his raw power would increase to 656 kg m/s (76th percentile among EDGEs in sample).
Alignment
Versatility - Aligned at Off-Ball LB on 54% of pass plays | EDGE on 40% percent of pass plays
Increased EDGE usage in Weeks 2-3 after D. Lawrence foot fracture in Week 1
Pass Rush % - EDGE: 90% (72/80 plays) | LB: 19% (20/106 plays)
Pressures - EDGE: 11 pressures on 72 pass rushes (15%) | LB: 8 pressures on 20 pass rushes (40%)
Advance Report Tendencies
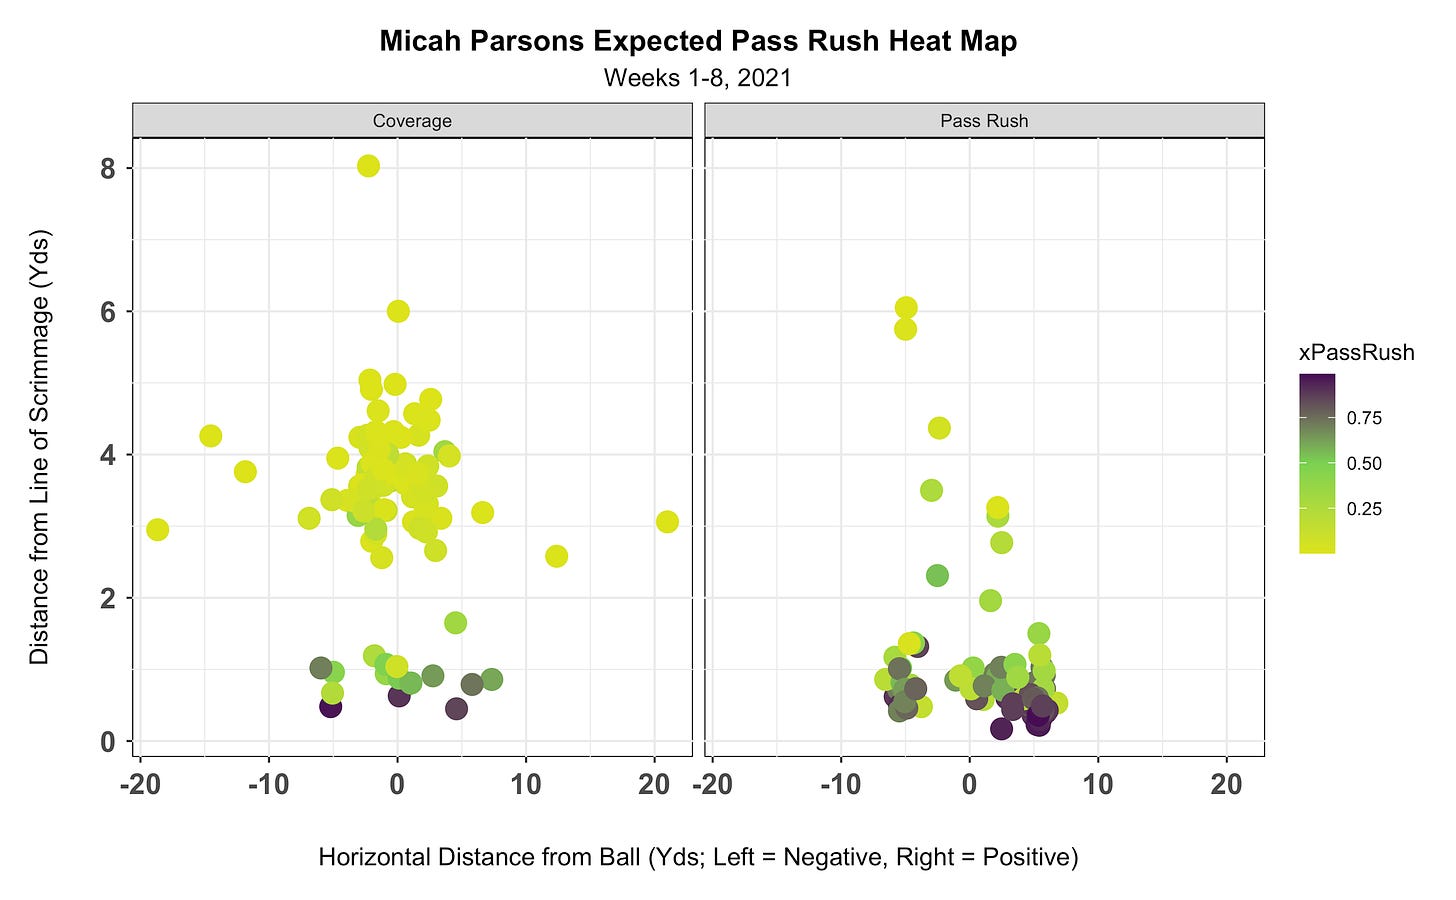
In the visual below — plays in which Parsons dropped into coverage are on the left and plays that he pass rushed are on the right. The color of the point indicates the probability Parsons was going to pass rush. In general, the closer to the LOS Parsons is the more likely he is to pass rush.
Pass rushes from the right side (OFF perspective) at a higher rate than the left
Pass Rush % - Right: 56% | Left: 36%
Aligned as Off-Ball LB - 27% pass rush probability from right | 10% from left
Pass Rush Probability - Right: 22% (+5 PROE) | Left: 11% (-1 PROE)
Pass Rush Over Expected (PROE) - Actual Pass Rush % - Pass Rush Probability
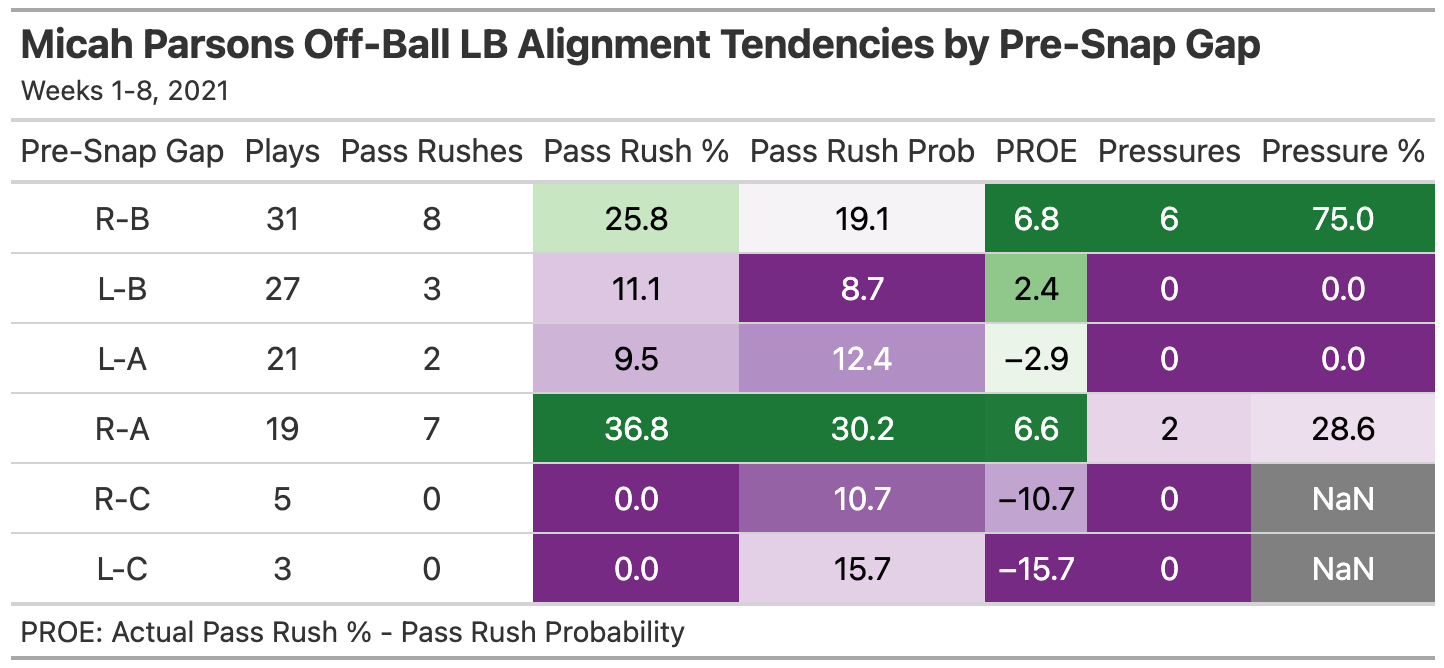
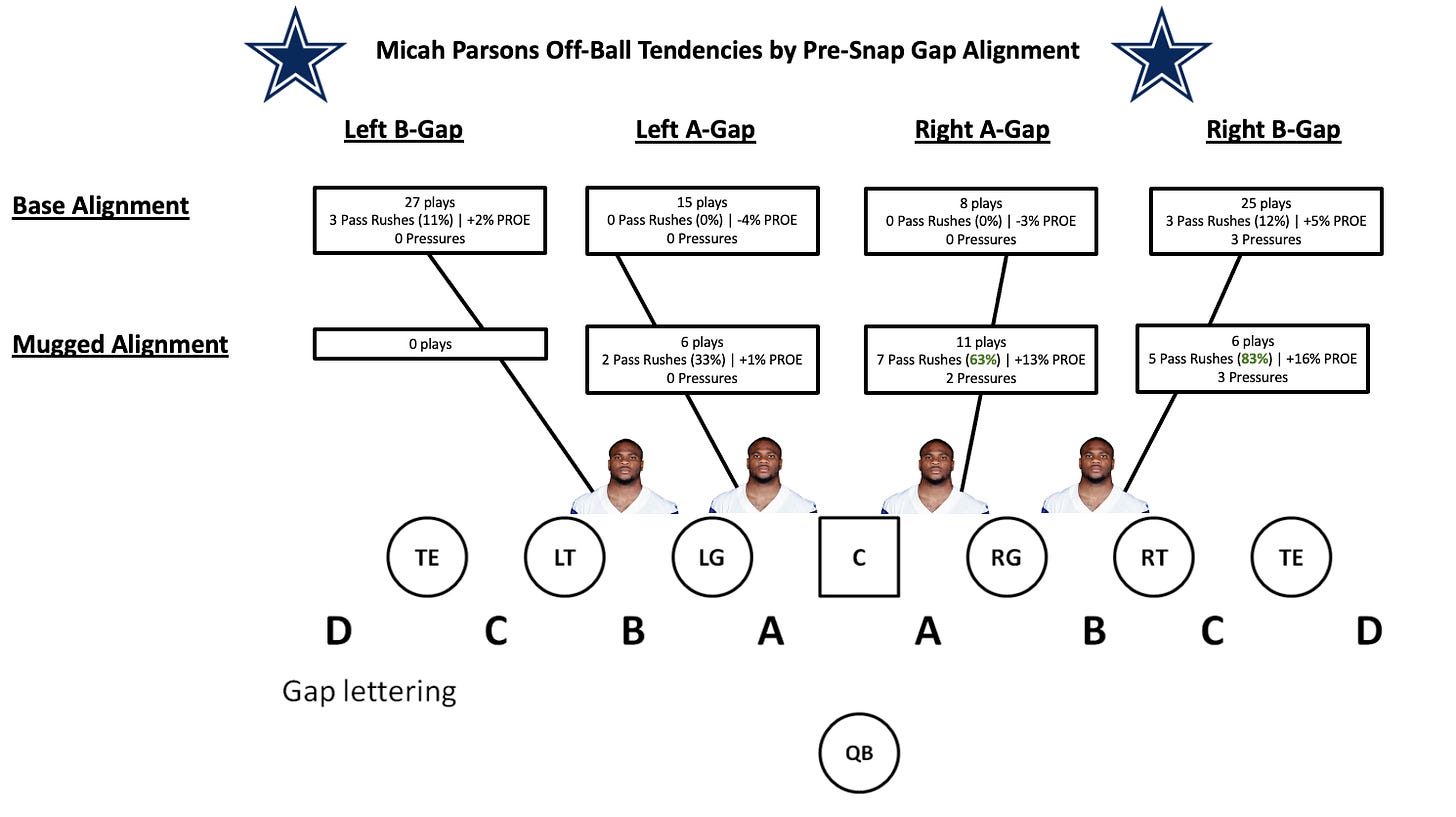
Mugged Alignment Right A & B Gaps - 12 pass rushes on 17 plays (71%)
Aggressive when aligned mugged in Right A & B gaps | +14% PROE
3 pass rushes on 33 plays not aligned mugged in Right A & B gaps (9%, 3 pressures)
Mugged defined as playing an Off-Ball LB position and being with 2 yards of LOS
Mugged Alignment Left A & B Gaps - 2 pass rushes on 6 plays
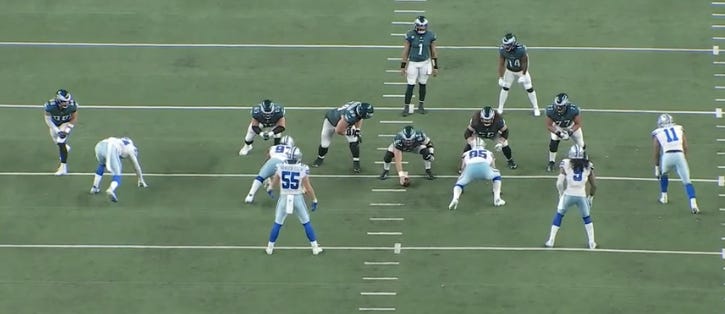
High pass rush probability example: 94%
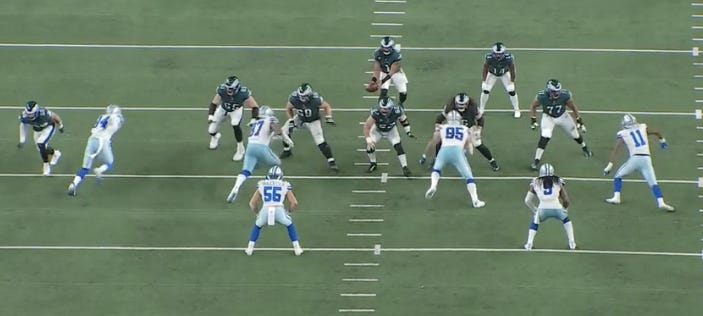
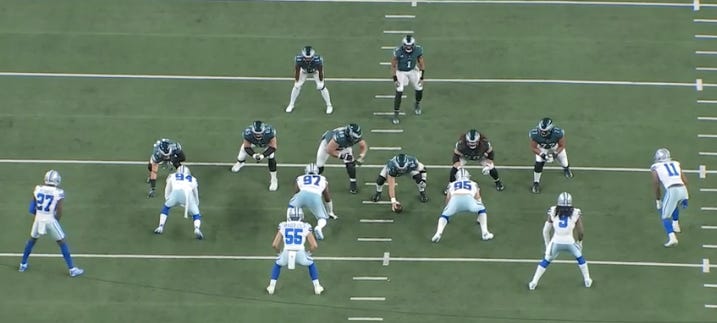
Low pass rush probability example: 18%
Parsons fooled the model here with his movement direction of 71 degrees (for reference see the field chart above. 70 degrees would approximately be diagonal from the helmet where the 20 yard line is for the visitor sideline).
Here are a few different visuals to consume the information on Parsons’ pre-snap gap tendencies.
EDGE Pressure by Side of Formation
Right Side Dominant - All 11 of Parsons pressures from an EDGE alignment were from the right side (24% Pressure Rate)
Positional Traits by Side -
Get-Off Speed - Left: 4.63 MPH | Right: 4.91 MPH
Average Raw Power Momentum - Left: 451 kg m/s | Right: 479 kg m/s
It is unlikely less than .3 MPH of Get-Off Speed makes an impact, but perhaps Parsons’ stance from the right side produces more power to defeat blockers
Level of competition doesn’t seem to be the driving factor
RT Matchups - Storm Norton: 6 pressures, Lane Johnson: 2 pressures, Tristan Wirfs: 2 pressures
LT Matchups - Cam Erving, Donovan Smith, Andre Dillard, Rashawn Slater (0 pressures vs all)
Player Development - 2-Point Stance
I looked further into this using film to pickup on nuances that the data cannot. I noticed that when Parsons aligned on the right in a two-point stance he more often than not had his outside foot in front of his inside foot. Whereas when he aligned on the left in a two-point stance he had his inside foot in front of his outside foot. However, there are examples of Parsons using both of these stances from either side. The loss of power is likely a result of his stance rather than the side of the formation he’s aligned on.
Left Side - Inside Foot In Front
Parsons generated a momentum of 417 kg m/s on this play.
Note how Parsons is practically in the same spot as he was prior to when the ball was snapped due to the false step or inside fake move. On the other side of the formation Randy Gregory is moving forward.
On the following play example where Parsons aligns his outside foot in front he generates one of his three highest momentums (630 kg m/s).
Left Side - Outside Foot In Front
If I worked for a team and saw a player doing this while producing negative outcomes in the data I would bring it to my manager and ask if it’s worth bringing to the position coach’s attention. If given the go ahead, I’d explain to the position coach that I noticed Parsons’ power is lesser from the left side than the right and that I noticed differences in his stance on film. That way I can learn if this is something he is being coached to do or if it’s something the data can help fix.
I am not a pass rush technique specialist so I am going to make educated guesses here based on the data and film.
Possible Explanation 1 - Parsons is more comfortable rushing with his outside foot in front of his inside foot. As a result when his inside foot is in front of his outside foot he false steps and produces less power.
Possible Explanation 2 - Parsons stances up with his inside foot in front of his outside foot when he wants to set up inside moves. The counter nature of the move creates less momentum.
In either case, this is something to note as false steps hurt pass rushers in how they generate explosiveness/power and having a pass rush move tell by the way you align in your stance can lose the snap before it starts.
Knowing what we know now this is clearly nothing to be concerned about as Parsons won the DROY and was second in DPOY last season. But it is good to note how information can help aid in how players develop throughout their careers.


