Measuring Pass Rusher Power: Pass Rush Momentum
Using physics to measure how much momentum a pass rusher generates at contact
Access to player tracking data across sports has increased the ways in which we can analyze players in recent seasons. In leagues like Major League Baseball, player traits that were once defined by traditional stats, like batter power with Slugging Percentage (SLG) can now be defined by more granular measures like a batter’s max exit velocity — which is the max speed the ball comes off a player’s bat.
Similar insights can be gained from the NFL’s tracking data. Football has advanced from sacks and sack rate to pressures and pressure rate to measure trench player production. Pressures have shown to be more predictive of future sacks than sacks themselves. It’s useful to be able to predict future production using basic metrics. However, pressures do not tell us how the pressure fundamentally happened.
Was the pressure due to the pass rusher’s initial speed off the ball? Did he generate power to beat the man across from him? What was his leverage, approach angle, or path to the quarterback?
The league has already quantified pass rush get-off time to measure how fast a pass rusher can cross the line of scrimmage after the snap or measure his speed within one second of the snap. The next component in the progression is measuring a pass rusher’s power.
Measuring Power Using Momentum
Pass rushers utilize speed moves, power moves, or a combination of the two to defeat blocks en route to the quarterback. We can quantify power by calculating how much momentum the pass rusher creates at the point of collision with the offensive linemen — where Momentum (P) = Mass (M) x Velocity (V)
Player weight is converted from pounds to kilograms and then divided by the acceleration due to gravity on the Earth (9.8 m/s^2). Velocity is calculated by converting distance in yards to meters and then dividing by the time in which that distance occurred. Given that each frame is a tenth of a second Velocity is equal to distance / .1.
The offensive lineman’s momentum is also a part of the equation in terms of the result. Assuming the pass rusher and the offensive linemen have opposing momentum directions, as momentum is a vector which means direction matters, we can calculate the difference in pass rusher momentum and offensive linemen momentum to determine who won the collision. The player who generated the most momentum at impact wins the collision battle. Only plays where a pass rusher has one matchup on the play have a momentum and momentum difference calculated. Players who attracted multiple blockers had significantly lower momentum figures than when they were solo blocked (Aaron Donald).
Additionally, using the player’s X,Y coordinates we can break down the pass rusher and o-line man’s vector components to calculate their X-momentum and Y-momentum.
Assumptions & Methods
Determining point of collision was the difficult part in this analysis. Players wear RFID chips in their shoulder pads to produce data points like their X, Y coordinates, speed, acceleration, direction, orientation, and distance covered every tenth of a second. But because of where the chips are located it’s not easy to determine point of contact as a player can make contact with another by fully extending his arms while the tracking chips lag behind.
Luckily, data driven assumptions can be made.
The NFL recently put on a competition to predict contact to improve player safety. The train dataset had a column of whether or not contact occurred from games during the 2020 season. I used this to determine how many yards of distance DL/OLB and offensive lineman were from each other at the point of contact to apply it to the 2021 dataset from this year’s Big Data Bowl. The average distance contact occurred between DL/OLB and offensive lineman was approximately 1.1 yards. I decided to use 1.3 yards, 75th percentile, as my cutoff point for the furthest distance contact can occur.
From there I analyzed the data to see if there were any frame by frame patterns. After looking for indicators like change in direction, orientation, velocity, and momentum throughout plays I noticed that momentum plateaued or decreased minimally for the pass rusher when within striking distance of contact. This was an indicator that the offensive lineman was slowing him down. In some cases immediately after the pass rusher’s momentum dipped, the offensive linemen’s momentum increased.
This is due to the Law of Conservation of Momentum which states that the amount of momentum remains constant and that the momentum lost by one object is equal to the momentum gained by the other object — or in this case football players.
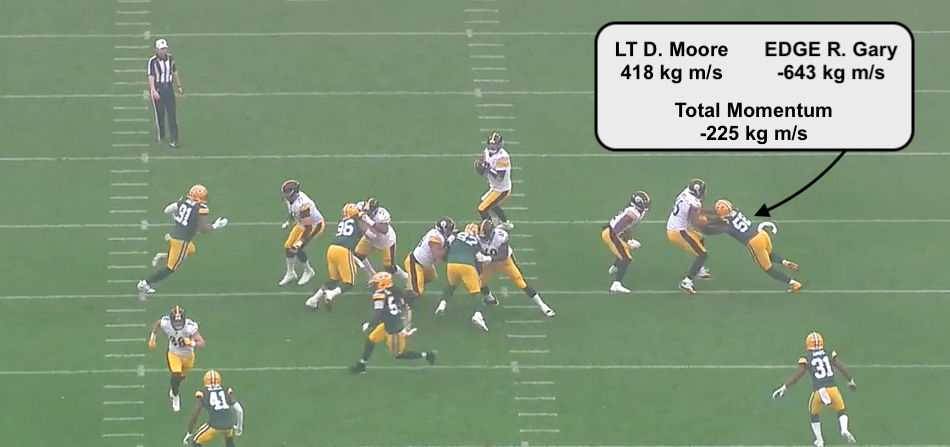
Let’s look at an example between Steelers left tackle Dan Moore and Packers EDGE Rashan Gary. According to my assumptions frame 21 is where the collision occurs.
On the graph we can see that Gary’s momentum plateaus around frame 18 and declines around frame 22. Frame 21 is the first frame where Gary is within 1.3 yards of Moore while his momentum stays the same or drops. In this graph we can see the Law of Conservation of Momentum at work. At frame 22 Gary’s momentum declines while Moore’s increases. It’s not a perfect example of the Law of Conservation as some momentum is lost but that can be attributed to external forces like air resistance, friction, and player’s pads which spreads out the length of the impulse.
Here’s the play of Gary bullrushing Moore.
It’s not a perfect method, but let’s assume an ideal situation that when Moore and Gary collide their momentums are heading in opposite directions to gauge who won the collision. In this scenario Gary is able to generate 225 kg m/s of momentum in his direction than his matchup.
The assumptions provide an approximation of what’s going on. In reality the LT is moving backward into his pass set but he’s also not moving in unison with the pass rusher despite having similar degrees directionally. At the point of collision the LT is pushing forward and resisting movement to slow down the pass rusher’s momentum, albeit unsuccessfully.
This is the part where I admit I am not a physicist, just someone who’s curious. I welcome constructive criticism to those with more knowledge on the subject who may have a better way of quantifying the relationship between matchups.
Alignment Matters for Momentum
Where a pass rusher aligns prior to the snap greatly impacts the momentum a player can create. Player’s aligned wider along the ball produce higher momentum figures than those who align inside. To simplify position groups I grouped pass rushers into two categories: EDGE and IDL. EDGE rushers produced an average momentum of 489 kg m/s while IDL rushers produced an average momentum of 368 kg m/s.
This makes intuitive sense as EDGE rushers have more space to build up their velocity and as a result, momentum. It’s potentially one reason why EDGE rushers like pass rushing from a wide-9 technique in addition to the angle it creates against the offensive tackle.
Aaron Donald is a prime player example to showcase this from the data. Donald had 48 solo blocked plays aligned as an IDL and 27 solo blocked plays aligned as an EDGE in the sample. On the interior he generated a momentum of 413 kg m/s, but on the EDGE he generated a momentum of 534 kg m/s.
Examining the Relationship Between Momentum & Pressure
Unfortunately there is not much of a relationship between momentum and pressure (defined as QB hits, hurries, and sacks) as I expected.
The following plot is one of many I made to examine the relationship between momentum and pressure. I examined the relationship on a play level and average player level (plot below). From there I looked at the relationship between EDGE momentum, IDL momentum as well as the X, Y vector components momentum and pressure rate. In addition, I looked into the relationship between momentum differences among matchups and that too did not result in any meaningful relationships.
For the most part momentum does not do a good job of explaining the variability in pressure rate and it is not statistically significant.
This could be the case for multiple reasons.
1.) NFL pass rushers only need to create a requisite amount of momentum.
Momentum is a major part of creating power to displace offensive linemen. From a physics standpoint, momentum matters. But it might not be an important feature in determining pressure rates in a population of NFL pass rushers due to everyone being big and fast. A followup to this research is, why are players like Randy Gregory that much more successful at generating pressure than players like Lorenzo Carter despite similar momentums?
2A.) Some sort of Effective Momentum metric might be more predictive of pressures.
Generating momentum is one thing. Using it to make an impact is another. An EDGE rusher can generate a high amount of momentum but can be ran around the arc or nudged slightly off course by a savvy offensive tackle. Detailed technique is a reason why a player like Maxx Crosby has been more successful than Takk McKinley.
For example, McKinley generates one of the highest momentums (726 kg m/s) on a non-pressure on this play against the Chiefs.
McKinley explodes off the LOS, but is unable to register a pressure because the right tackle is in a position to deflect him off his track to the quarterback.
An idea for further research would be to create an Effective Momentum metric that is guided by the pass rusher’s direction in relation to the quarterback and leverage of his matchup.
2B.) Pass rush moves might need to be accounted for.
The collision of a bullrush is different than that of a speed rush. While both create momentum the goal of a bullrush is to explode into the offensive lineman and jolt him backwards. A speed rush is trying to get around the offensive lineman using explosiveness, leverage, and bend while usually only making partial contact.
PFF charts pass rush moves, but only on pressures. Using the data I have the most common pass rush moves are: Outside Move (2,932), Inside Move (2,874), and Bullrush (1,898). Which indicates there are not a lot of clean collisions due to players using speed and technique than pure power.
3.) Sometimes pass rushers are trying to create a pressure opportunity for their teammates rather than themselves. For instance, on stunts there is a penetrator who attempts to occupy the offensive guard and tackle to his side of the formation by crashing into them to free the looper coming inside or outside — depending on the stunt type.
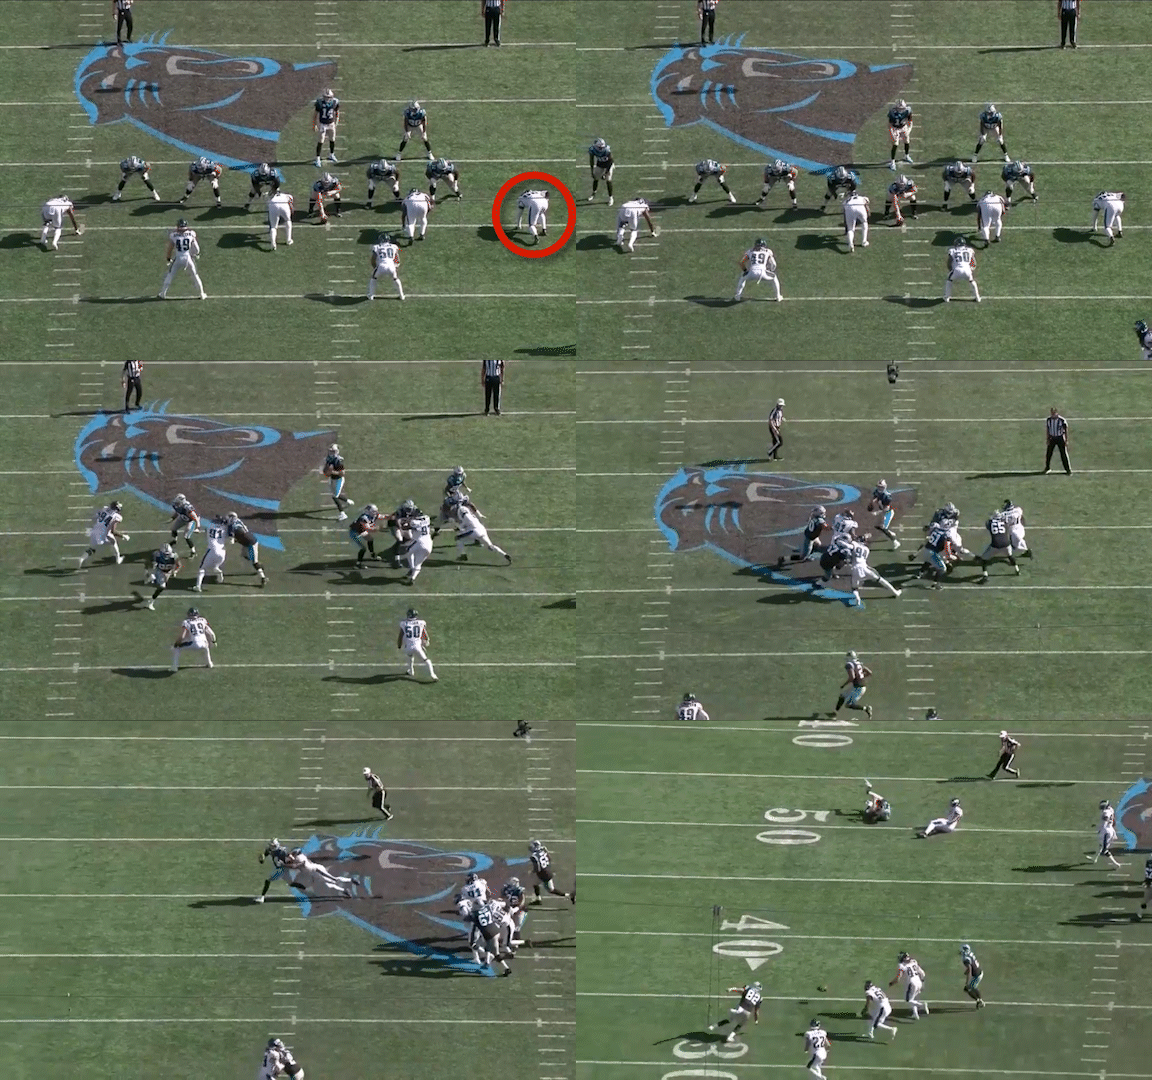
Using my pre- and post-snap gap classification code script I made a query to identify some of highest momentums generated on stunts that resulted in a team pressure, but not a pressure for the individual. To be considered a player had to be in a different gap post-snap than they were pre-snap indicating they were part of the stunt. The query resulted in the following play:
The Eagles run an E-T Stunt where DE Derek Barnett acts as the penetrator. Barnett generates 774 kg m/s of momentum crashing inside and occupies both the offensive tackle and the offensive guard while the DT Javon Hargrave freely loops around the outside for a pressure leading to an incompletion.
Pass Rusher Momentum could potentially be useful to create more favorable outcomes for defenses on stunts by determining which players and alignments can create more power when crashing for the looper.
Conclusion
Momentum can serve as a placeholder for determining the raw power potential for a pass rusher and may have usefulness for identifying successful penetrators to free up teammates on stunts. But quantifying momentum for pass rushers is not yet useful in terms of translating into individual pressures.
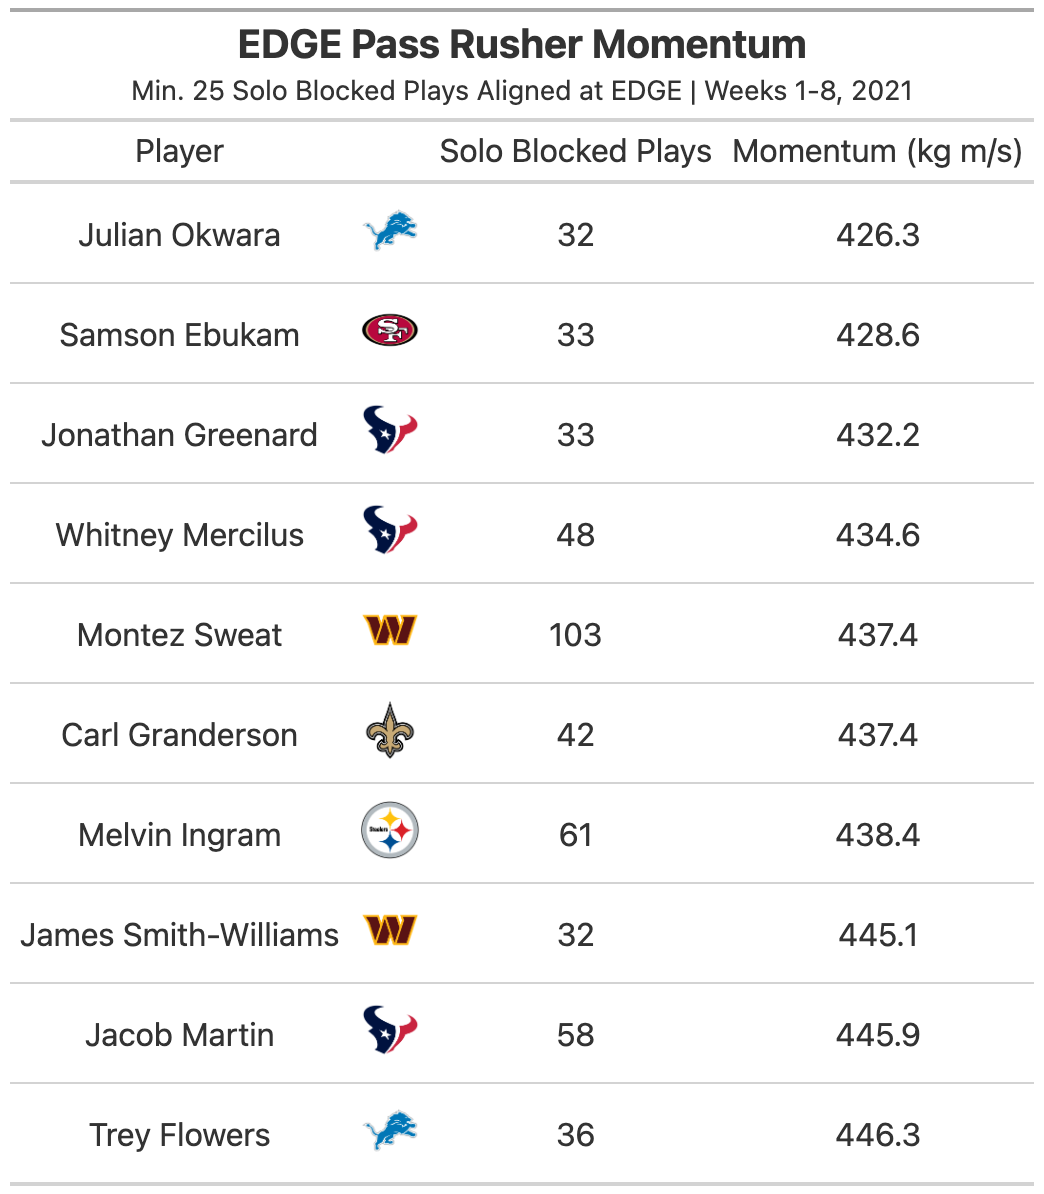
Here are the leaders in Pass Rusher Momentum from the EDGE and IDL positions.


