Projecting NFL Draft Pass Rusher Year 1-3 Sacks Using Combine & Production
How many sacks is David Bailey projected to generate?


I wanted to try my hand at projecting NFL Draft pass rushers’ sack totals in the first three years of their careers using only Combine and production-based metrics. A lot of draft models use projected draft position or a scout ranking/grade. For the purposes of this project I didn’t want subjective opinions, whether aggregated or not, to influence the model. Expected draft position would likely be the most predictive feature, but including it would defeat the purpose — I wanted to see what the numbers alone could say.
Or in this case — how much of a pass rusher’s early NFL production can be predicted from pre-draft measurables and college production alone?
To answer, I built a model that takes combine testing, physical measurables, and PFF college production data for edge/interior pass rushers from 2015-2023 and tries to predict their three-year NFL sack total. I decided to use sacks as the target variable because while there is variance in year-to-year sack production, the measure is still a valuable and wanted outcome for pass rushers. And good players generally should accumulate sacks over a period of time.
Data & Methodology
Combine measurables and testing results from nflreadr (height, weight, arm length, 40, 10-split, three-cone, shuttle, broad jump, vertical, bench)
PFF college pass-rush production for each player’s last college season (pressures, pressure rate, PFF grade, pass-rush win rate, batted passes, etc.)
NFL regular-season sack totals from play-by-play, summed across each player’s first three pro seasons
I settled on using a quantile regression forest so that every prediction comes with a distribution. I then compared it against a handful of simpler baselines (a linear model on the full feature set, a linear model on CFB pressures alone, a SPARQ + weight model, and the always-predict-the-mean floor) to see how much the QRF model was actually adding. All comparisons use out-of-sample predictions: 5-fold cross-validation for the linear models, out-of-bag predictions for the forest.
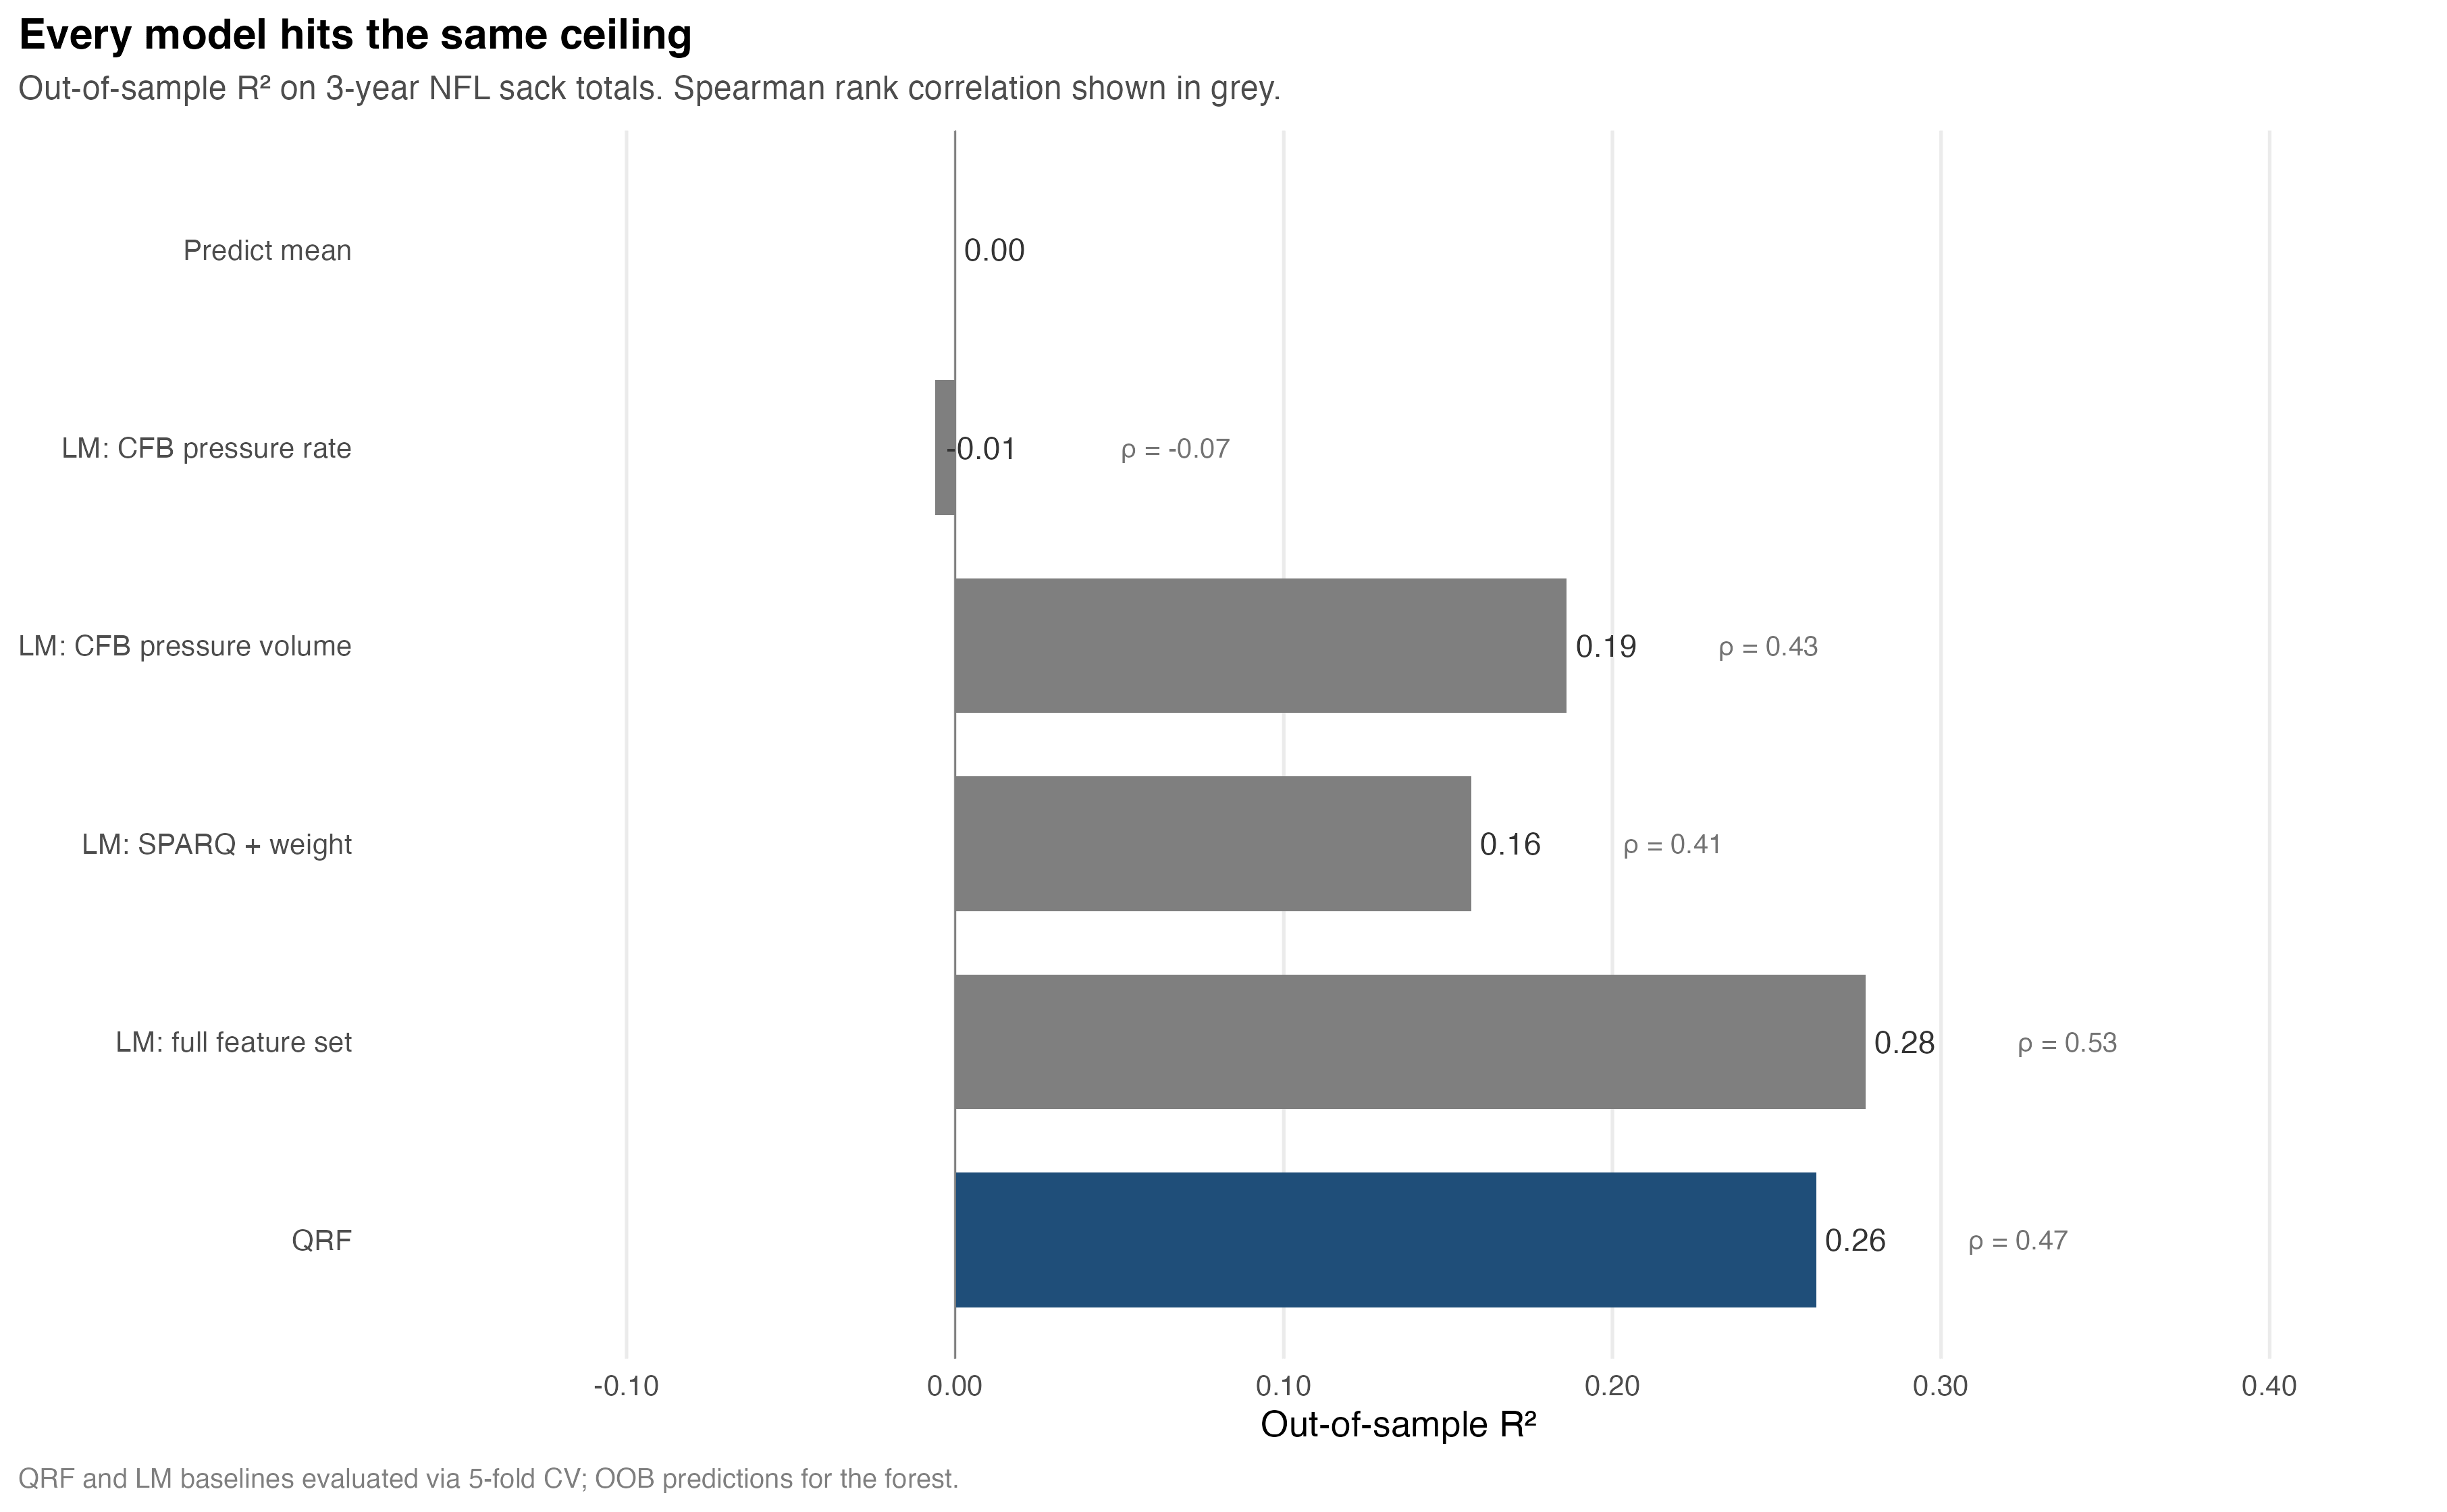
Interestingly, a linear model on the full feature set performed about as well as the QRF. I trimmed redundant features (e.g., true-pass-set win rate when I already had pass-rush win rate) for similar results with less noise.
Model Takeaways
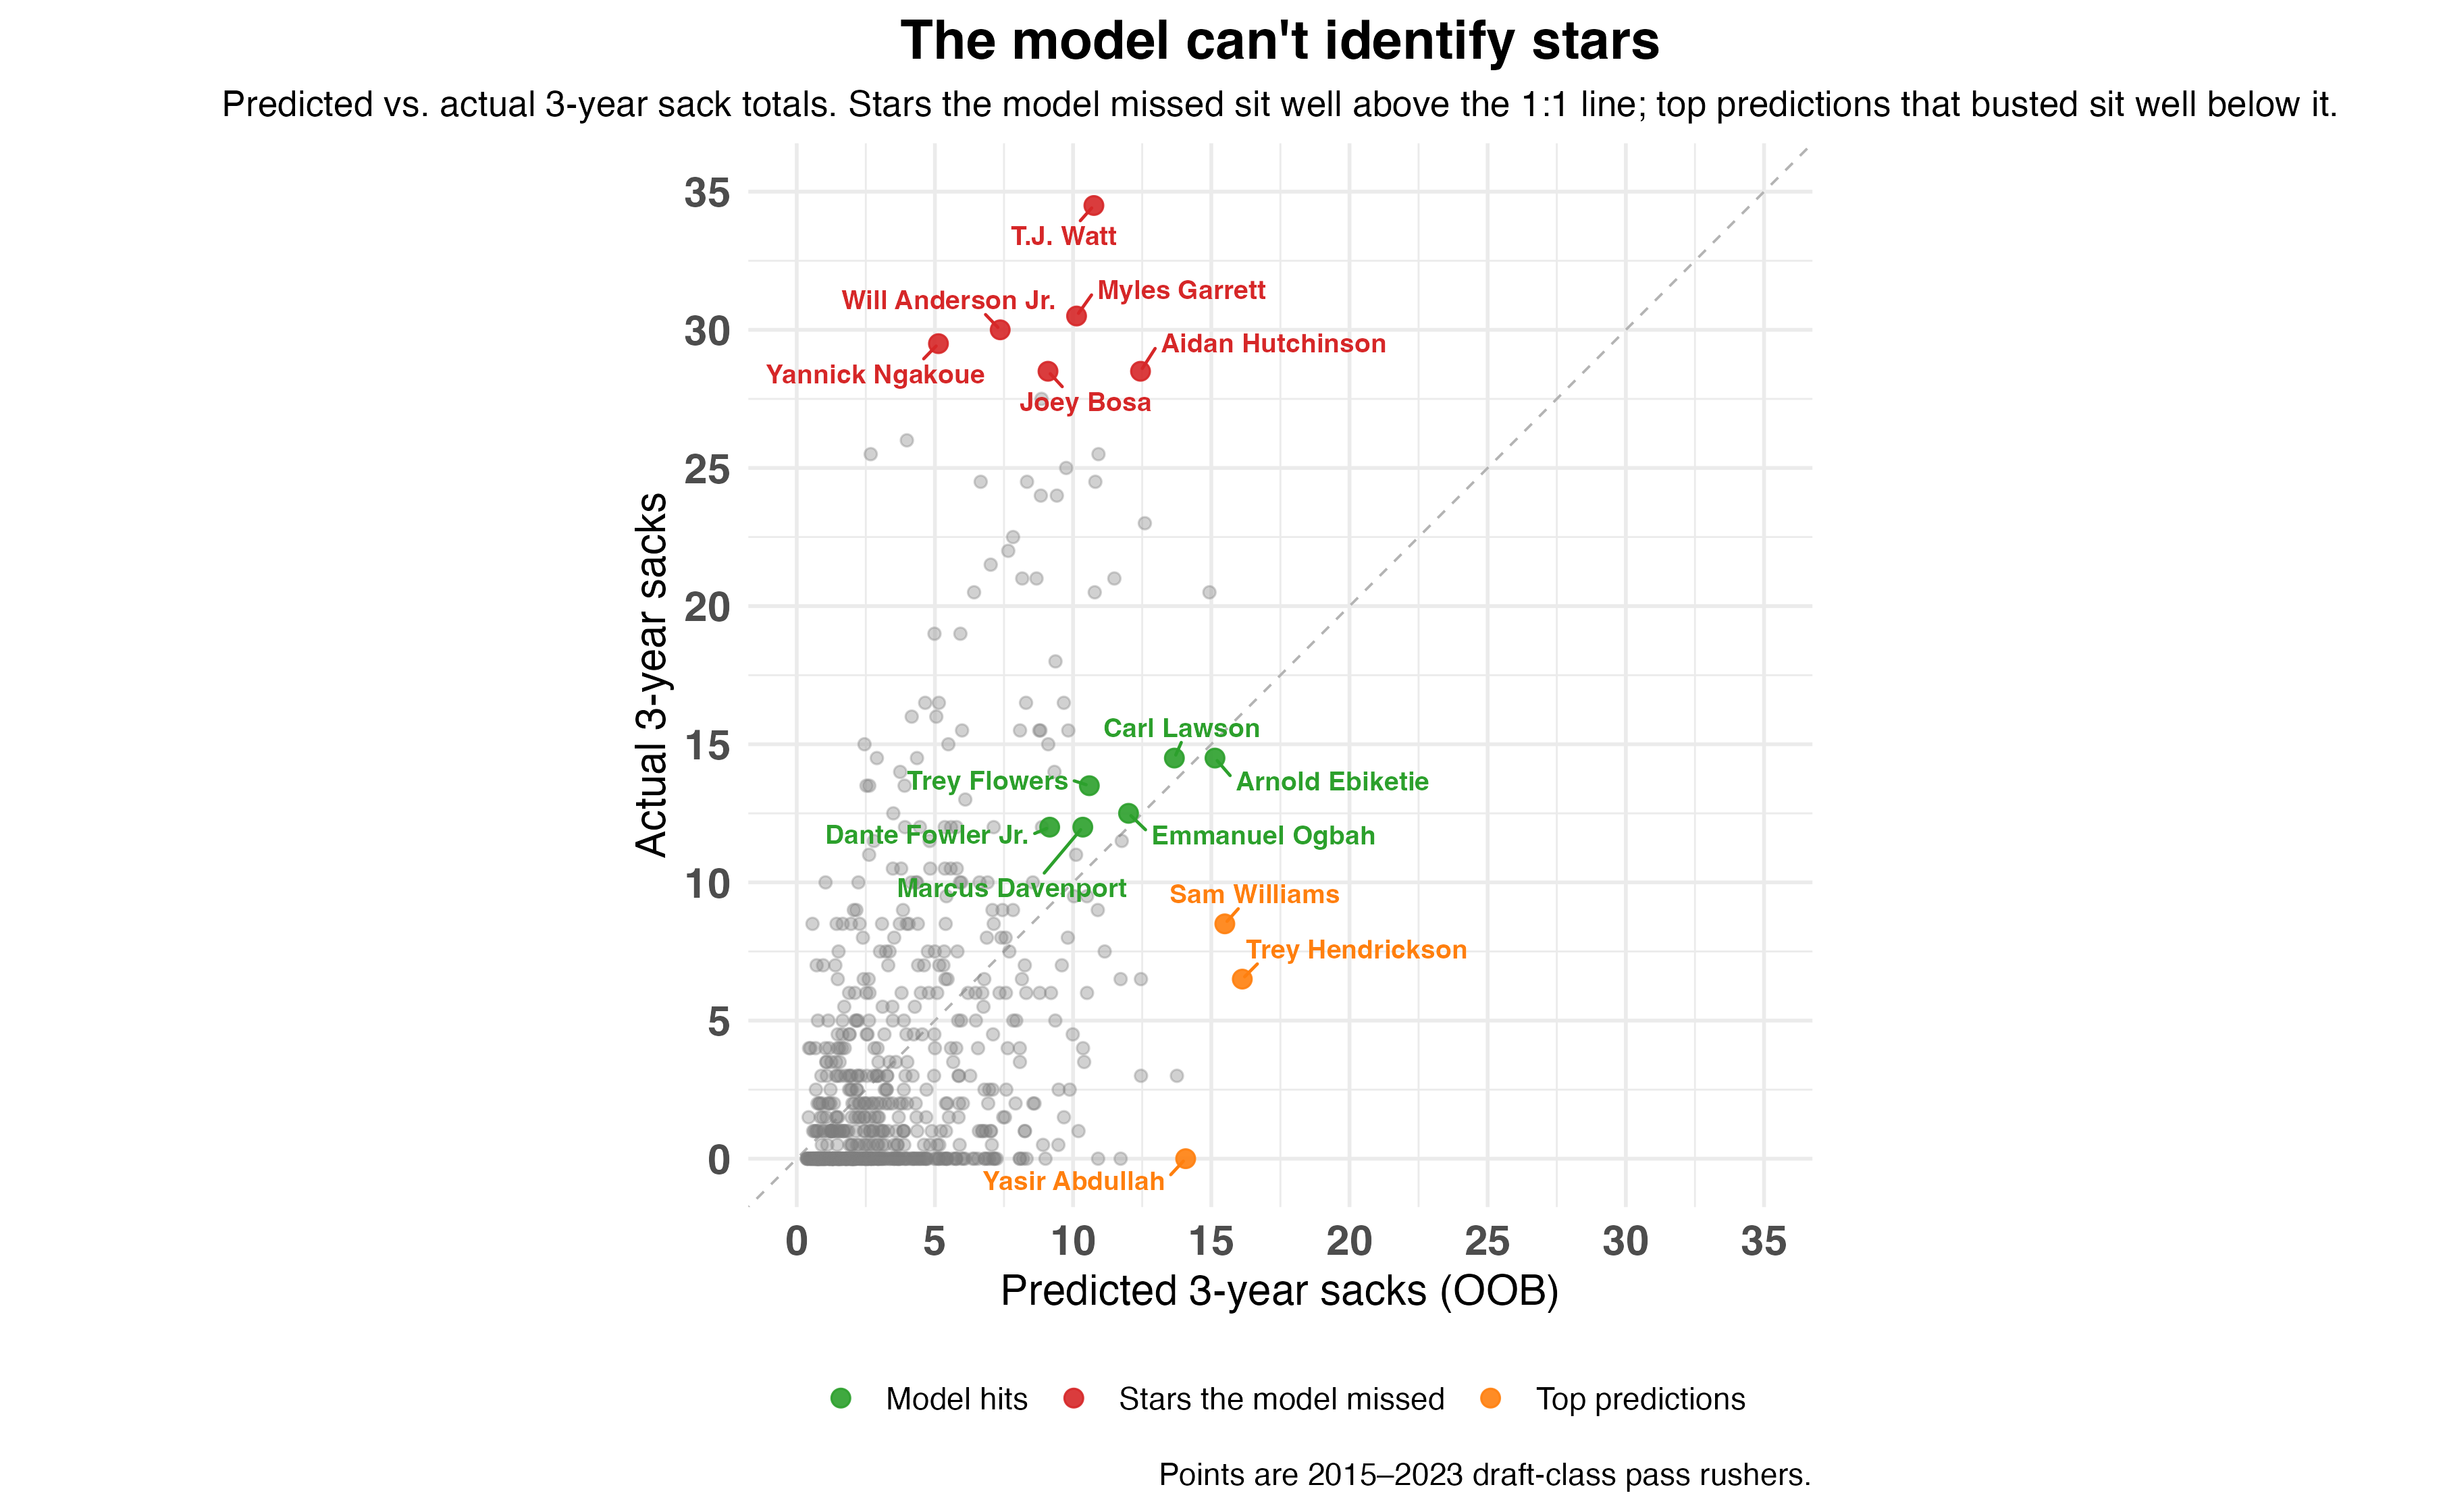
The model hits a clear ceiling, and it’s visible in two directions.
First, the model can’t predict stars. T.J. Watt had 34.5 sacks in his first three seasons. The model predicted 7. Myles Garrett: 30.5 actual, 5 predicted. Will Anderson Jr., Joey Bosa, Nick Bosa, Danielle Hunter — the entire top of the actual-sacks list sits well below the 1:1 line. The model’s highest prediction for any past player was around 16 sacks. Nobody in the top 10 of actual production was predicted above 8.
Second, the model’s top picks tend to bust. The players with the highest projected sack totals — guys whose combine-plus-production profiles look the most like “NFL pass rusher” on paper — include names like Sam Williams (8.5 actual), Adetomiwa Adebawore (6.5 actual), and Channing Tindall (0 actual). These are rotational players or worse. The model wasn’t wrong about Trey Hendrickson, however, just early.
There’s only so much Combine data and college production can do on their own.
2026 Class Results & Notable Prospect Distributions
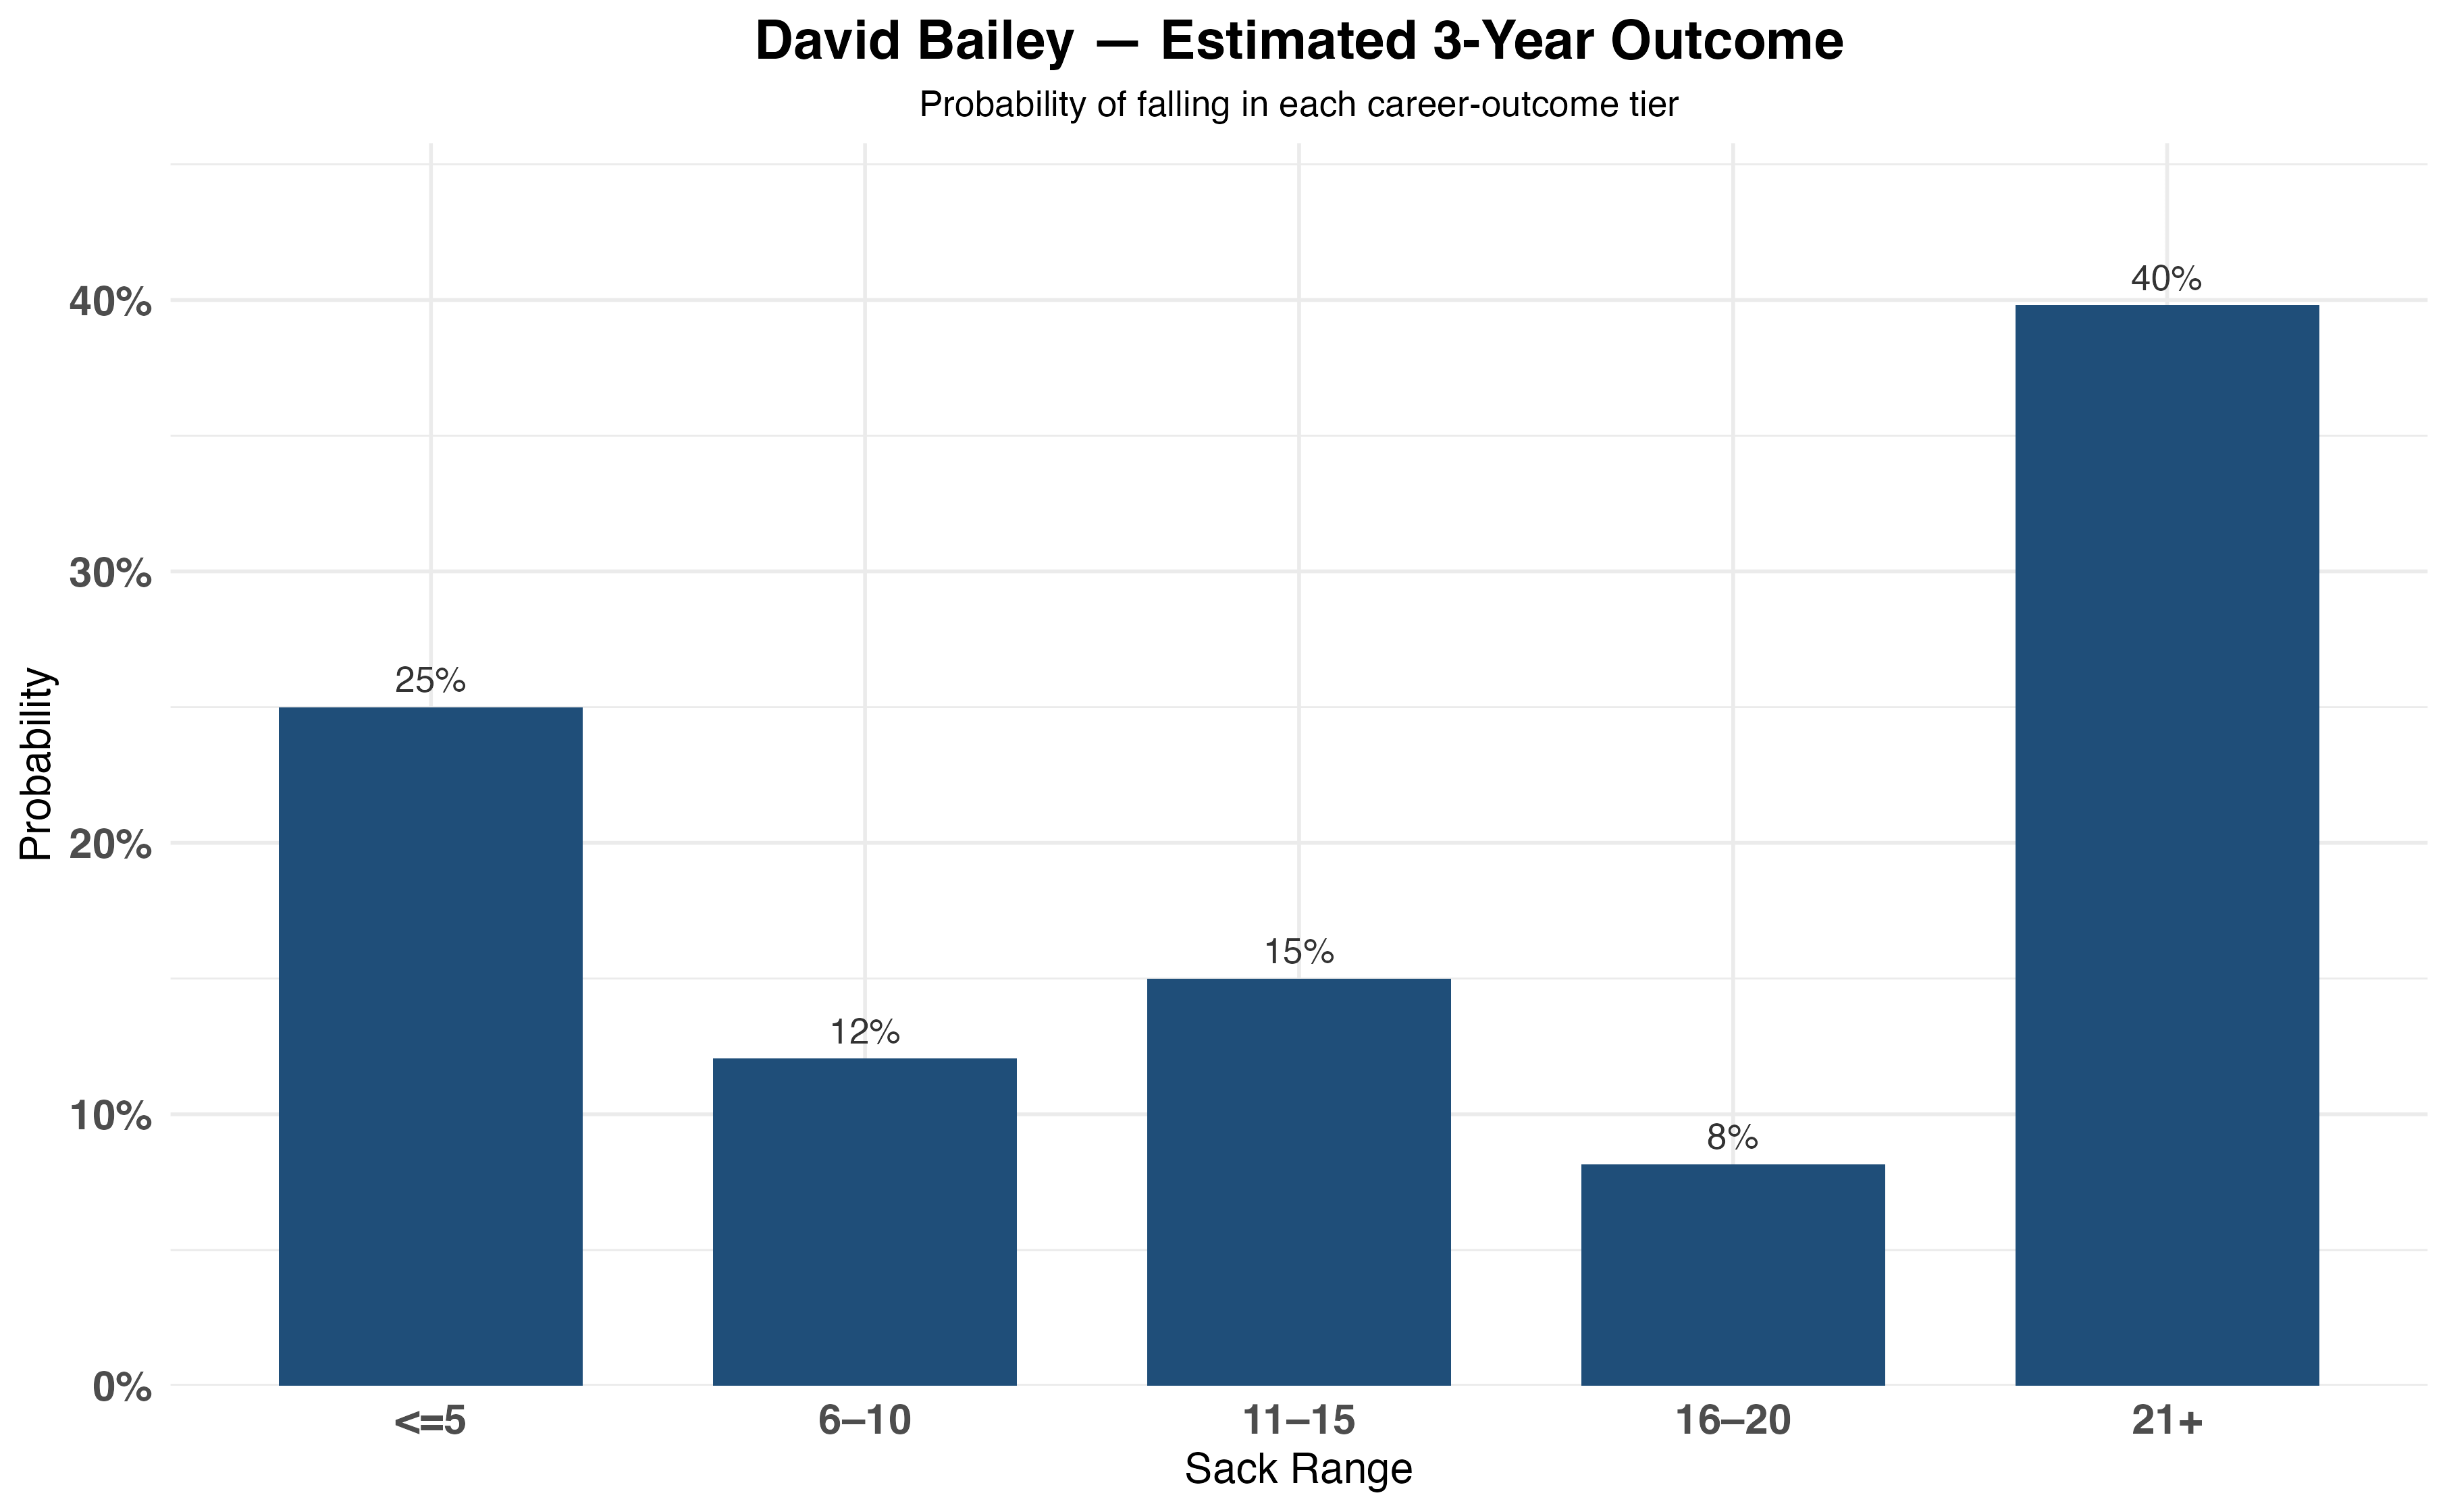
Here's what the model says about the incoming 2026 class. David Bailey, the consensus ED1, is also our ED1 — predicted to accumulate ~15 sacks in his first three NFL seasons. A notable player omission, Arvell Reese projects to 3.3 sacks, but this deserves a grain of salt: he split time at ED and LB in college and the model can't account for the projection to potentially playing full-time at ED.
# A tibble: 10 × 3
display_name position predicted_sacks
<chr> <chr> <dbl>
1 David Bailey EDGE 15.4
2 Nadame Tucker EDGE 11.6
3 Romello Height EDGE 11.5
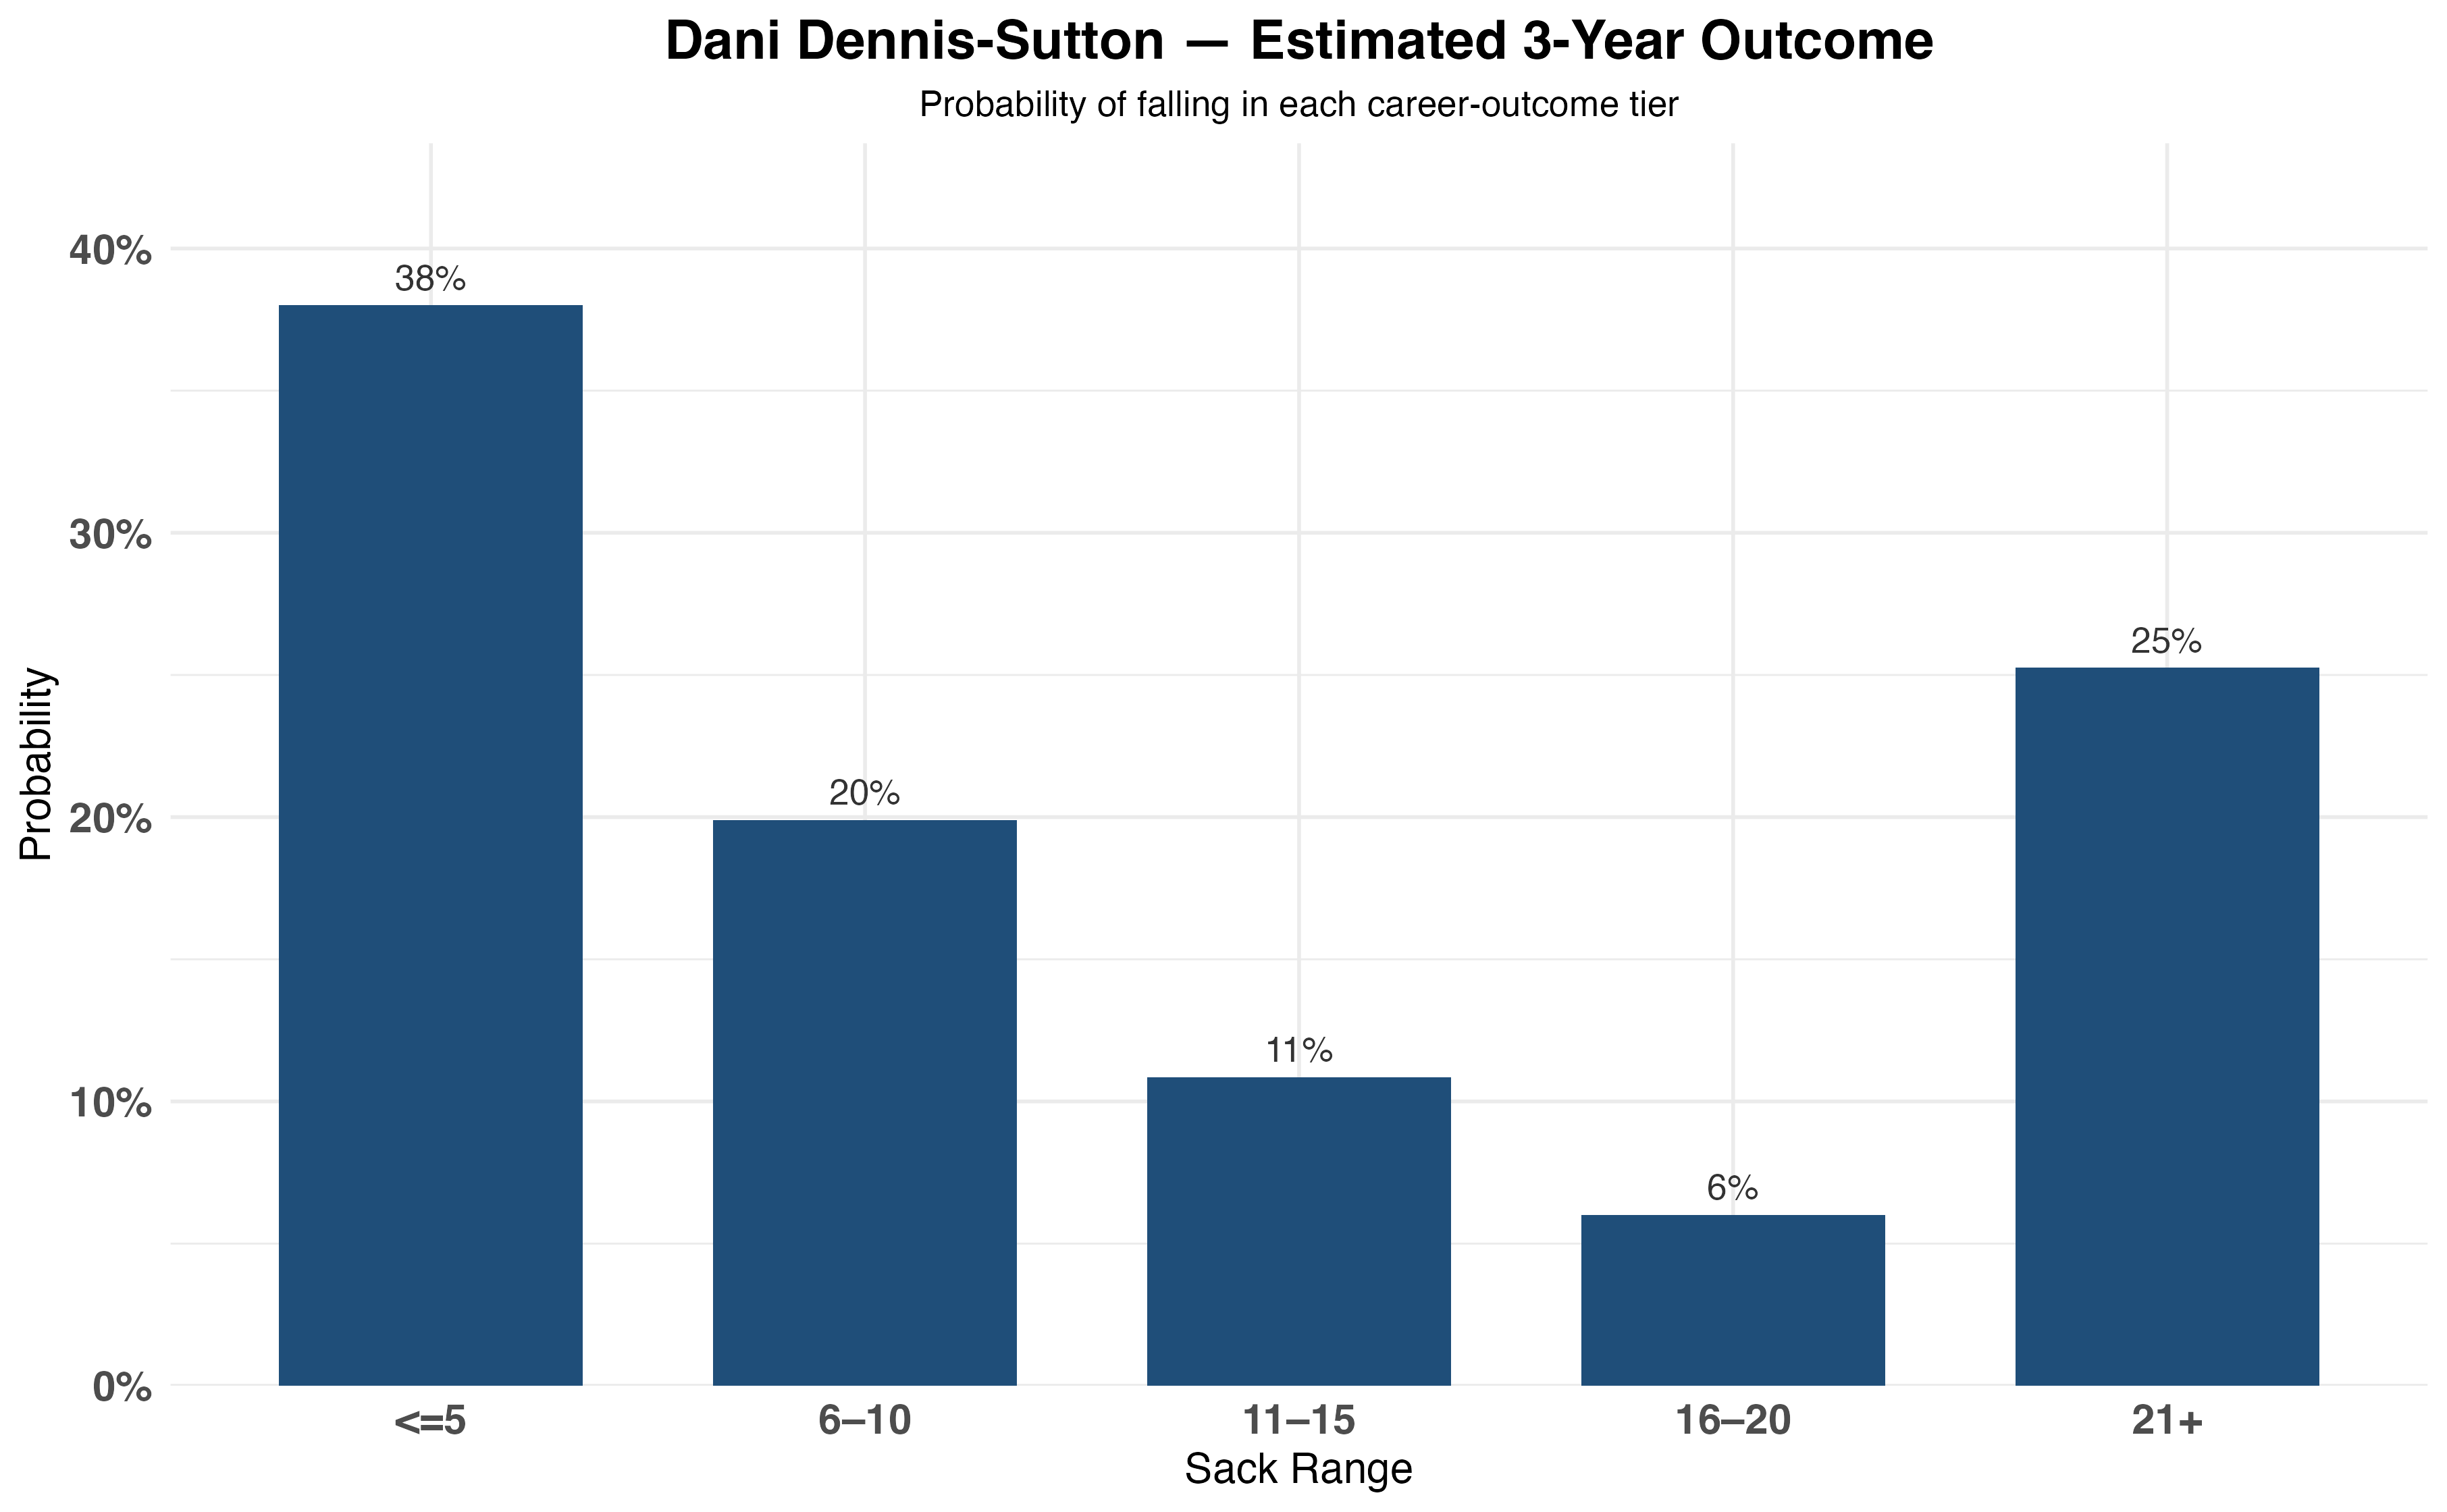
4 Dani Dennis-Sutton EDGE 11.4
5 Malachi Lawrence EDGE 9.92
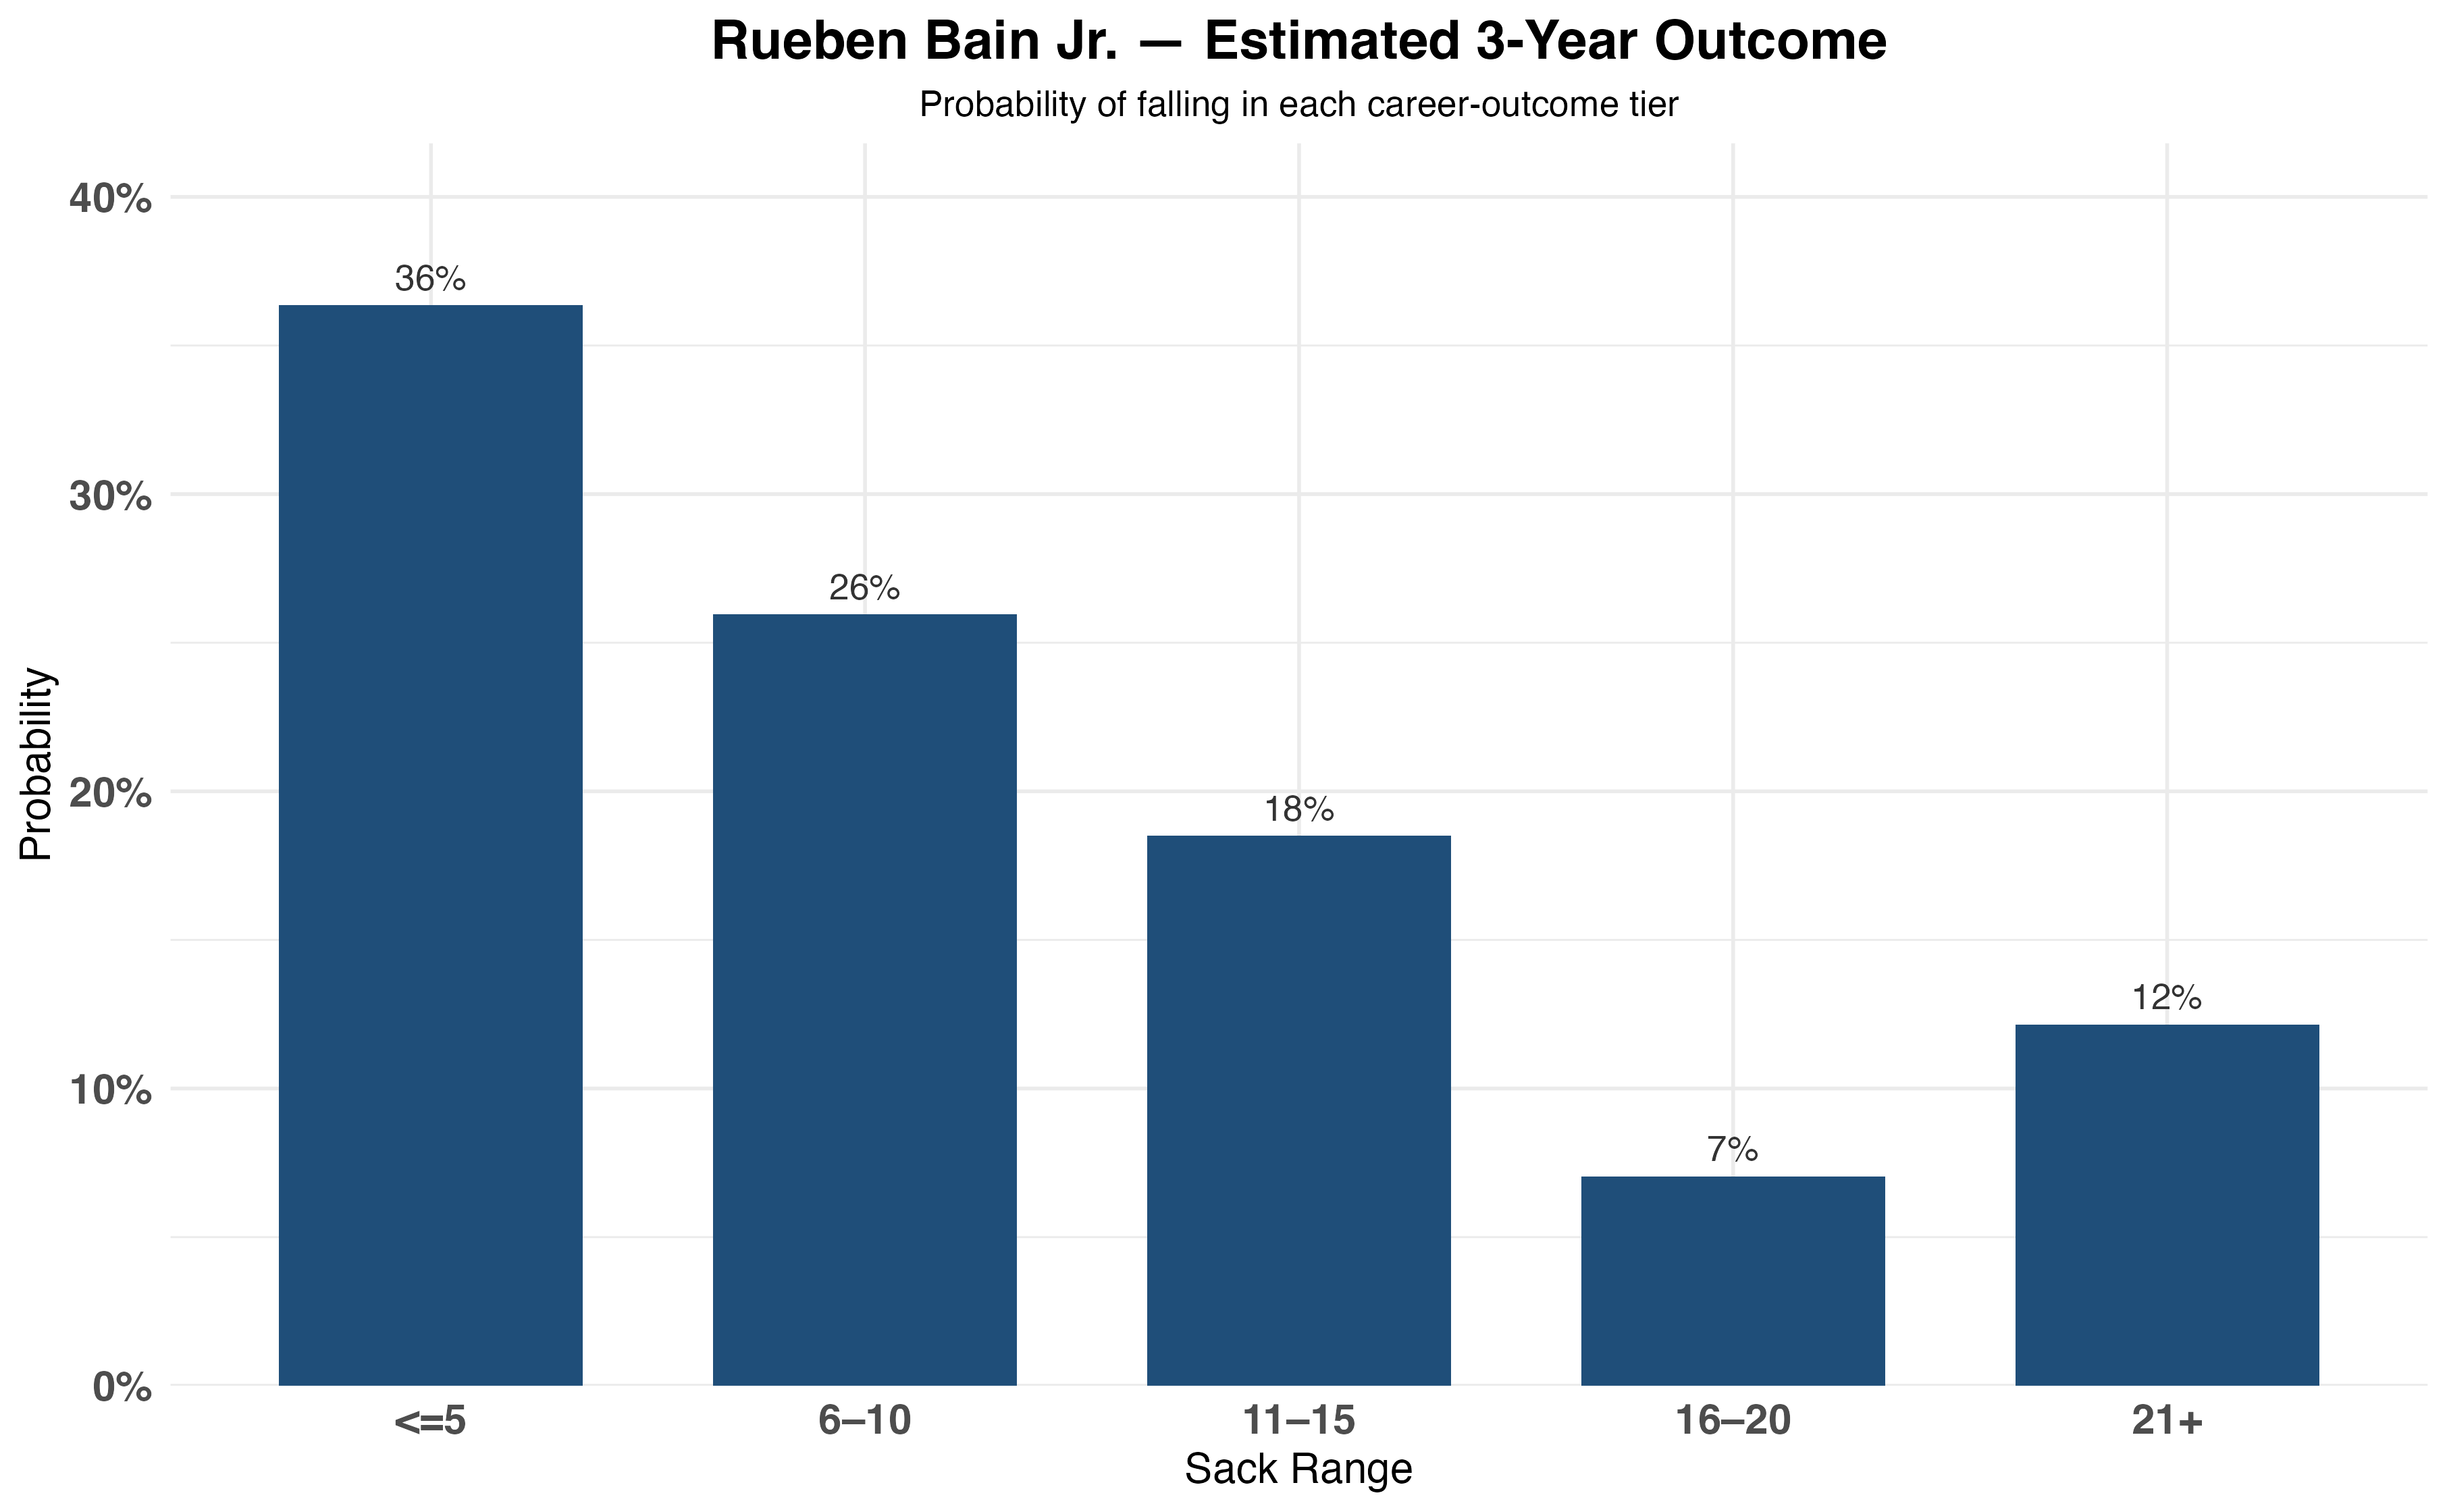
6 Rueben Bain Jr. EDGE 9.76
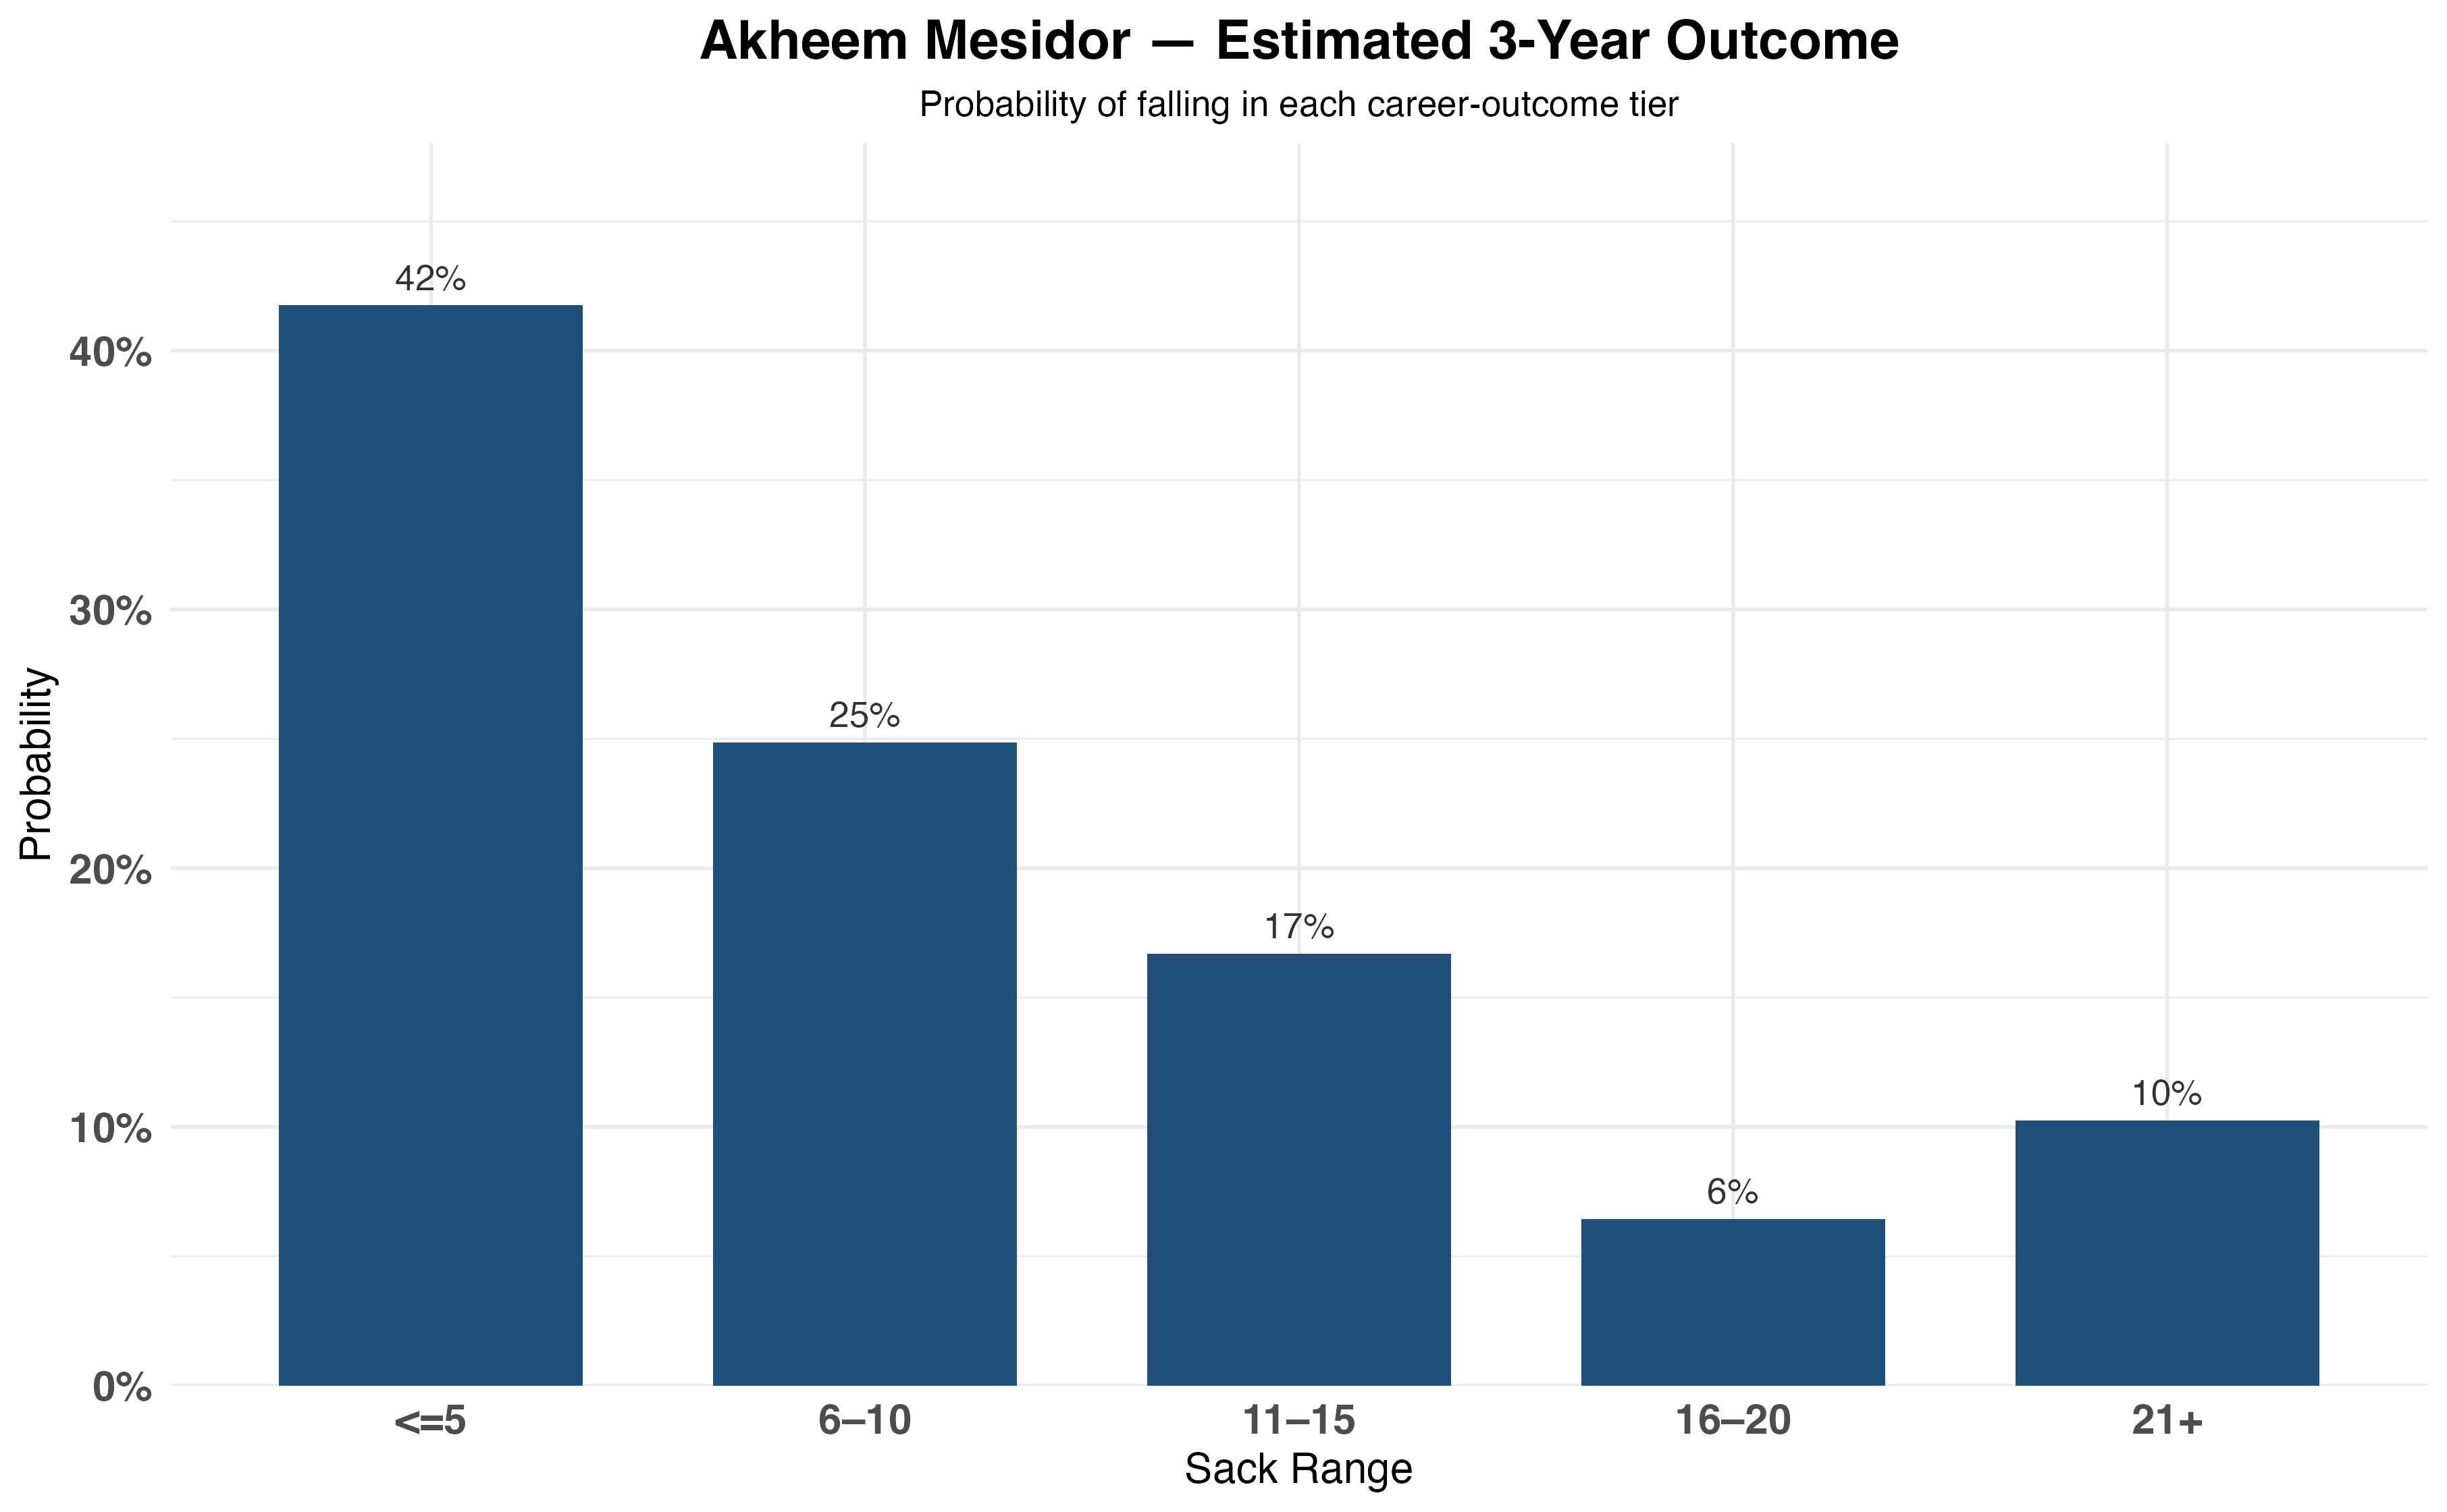
7 Akheem Mesidor EDGE 8.97
8 Mason Reiger EDGE 7.89
9 Caden Curry EDGE 7.45
10 Zion Young EDGE 7.43The QRF also provides a distribution of possible outcomes. Each plot below shows the probability a prospect lands in a given sack range over their first three NFL seasons, based on historically similar profiles. Here are some interesting results.
Limitations
Sacks are a noisy target. They depend on scheme, landing spot, opposite-side pass rush, injury luck, and opportunity — none of which is present in the pre-draft data.
Measurables and college production are incomplete. Bend, hand usage, pass-rush plan, motor, football IQ — these are the things that separate pass rushers at the NFL level, and none of them is in a PFF dataset or a combine workout. Two players with identical 40 times and identical pass rush win rates can be entirely different prospects.
No expected draft position. Round and pick number are the single strongest predictors of NFL production in published research, but they’re a proxy for exactly the scout signal this exercise is trying to exclude. Plus higher picks get more opportunity to produce regardless of skill. Leaving draft capital out makes the model worse as a pure prediction tool but keeps the question honest: what can numbers alone see?
The answer appears to be about a quarter of the variance. The rest is everything else.