
Pass Rush Move Mixed Strategies & Sequencing
Do pass rushers who vary their moves have more success?


What do San Francisco 49ers’ EDGE Nick Bosa (6-4, 267 lbs) and Atlanta Braves’ SP Chris Sale (6-6, 180 lbs) both have in common?
This may sound like an odd comparison, but despite their obvious differences in professions and body composition, the two are both trying to keep their opponent guessing on what their next move (pass rush or pitch) will be.
You see — from a strategic standpoint pass rushers are like baseball pitchers. They have an arsenal of pass rush moves similar to a pitcher’s arsenal of pitches. There is a mental game that takes place between downs, between pitches. Pass rushers and pitchers strategize ways to setup offensive linemen and batters, respectively, hoping to catch them off balance enough at a critical point later on in the sequence.
I never had, nor will have, the physique of an EDGE rusher. But growing up I was wiry kid who played a lot of baseball and would pitch on occasion. I clearly did not have the repertoire of pitches or pure stuff that Sale had, but had a basic three pitch mix (four seam, two seam, and changeup) to get the job done given the level of competition. This is all to say that I know from experience that even at such low levels of the sport you have to be able to theorize between pitches on how to attack the hitter.
An internal monologue might go like…
How did the hitter react to my last pitch? Was he early, late, or on my fastball? If he’s late, I may throw it again — or the batter may be expecting that, allowing me to throw a changeup and catch him swinging early.
Here’s a Major League example from May 14th - Chris Sale vs Mike Tauchman to better illustrate my point.
Situation - Inning: 1 | Count: 1-1 | Pitch Type: Slider
Situation - Inning: 1 | Count: 1-2 | Pitch Type: Slider
Sale went Slider-Slider to strikeout Tauchman in the 1st inning. Now keep that in mind as Sale faces Tauchman again the second time through the order.
Situation - Inning: 4 | Count: 1-1 | Pitch Type: Slider
Before we get to the next pitch of the sequence pretend you’re in the batter’s box. Sale went Slider away - Slider away in the 1st inning resulting in a strikeout. Then, in the second plate appearance, on another 1-1 count goes Slider away again. Tauchman hasn’t gotten a piece of the pitch yet. You’re probably thinking Sale is going to throw the slider away once again to try and get the punch-out…
Wrong.
Situation - Inning: 4 | Count: 1-2 | Pitch Type: Fastball
Sale throws the four-seam fastball (+19.5 MPH difference compared to his previous slider) by Tauchman for the second out of the inning.
I imagine the same goes for a pass rusher throughout a game.
How did the tackle react to the outside speed move? Was he late to his spot? The tackle might overset now and allow a wider path to counter inside.
Nick Bosa against Stone Forsythe in the 49ers Week 12 matchup vs the Seahawks provided such an example. Bosa reaches a max speed of 10.82 MPH on the play to run around the outside shoulder of Forsythe, who doesn’t get enough depth into his pass set.
Pressure. Sack. Third and very long upcoming.
Situation - Down: 2nd | Distance: 8 | Play of Drive: 2nd | Pass Rush Move: Outside

On the next play Forsythe has to account for the outside speed move Bosa just utilized. Forsythe does just that by getting out of his stance quicker and getting more depth to be in position to run Bosa around the arc.
Situation - Down: 3rd | Distance: 16 | Play of Drive: 3rd | Pass Rush Move: Inside
But Bosa counters, utilizing a well timed inside spin move to defeat Forsythe’s strike and causes the pressure.
Is Rush Move Balance Better for Creating Pressure?
I calculated the standard deviation across each player’s pass rush move percentages to determine the most balanced pass rush move mix by the EDGE rushers in the dataset. For this research the lower the standard deviation, the more balanced the player’s pass rush move distribution is. Conversely, the higher the standard deviation is, the more imbalanced the player’s pass rush move distribution is.
Below are the most balanced pass rush distributions for EDGE rushers. It’s great to see Bosa and Trey Hendrickson at the top here as they’re two of the most technically refined pass rushers in the NFL.

But does a more balanced pass rush mix equate to a higher pressure rate? Generally, yes.
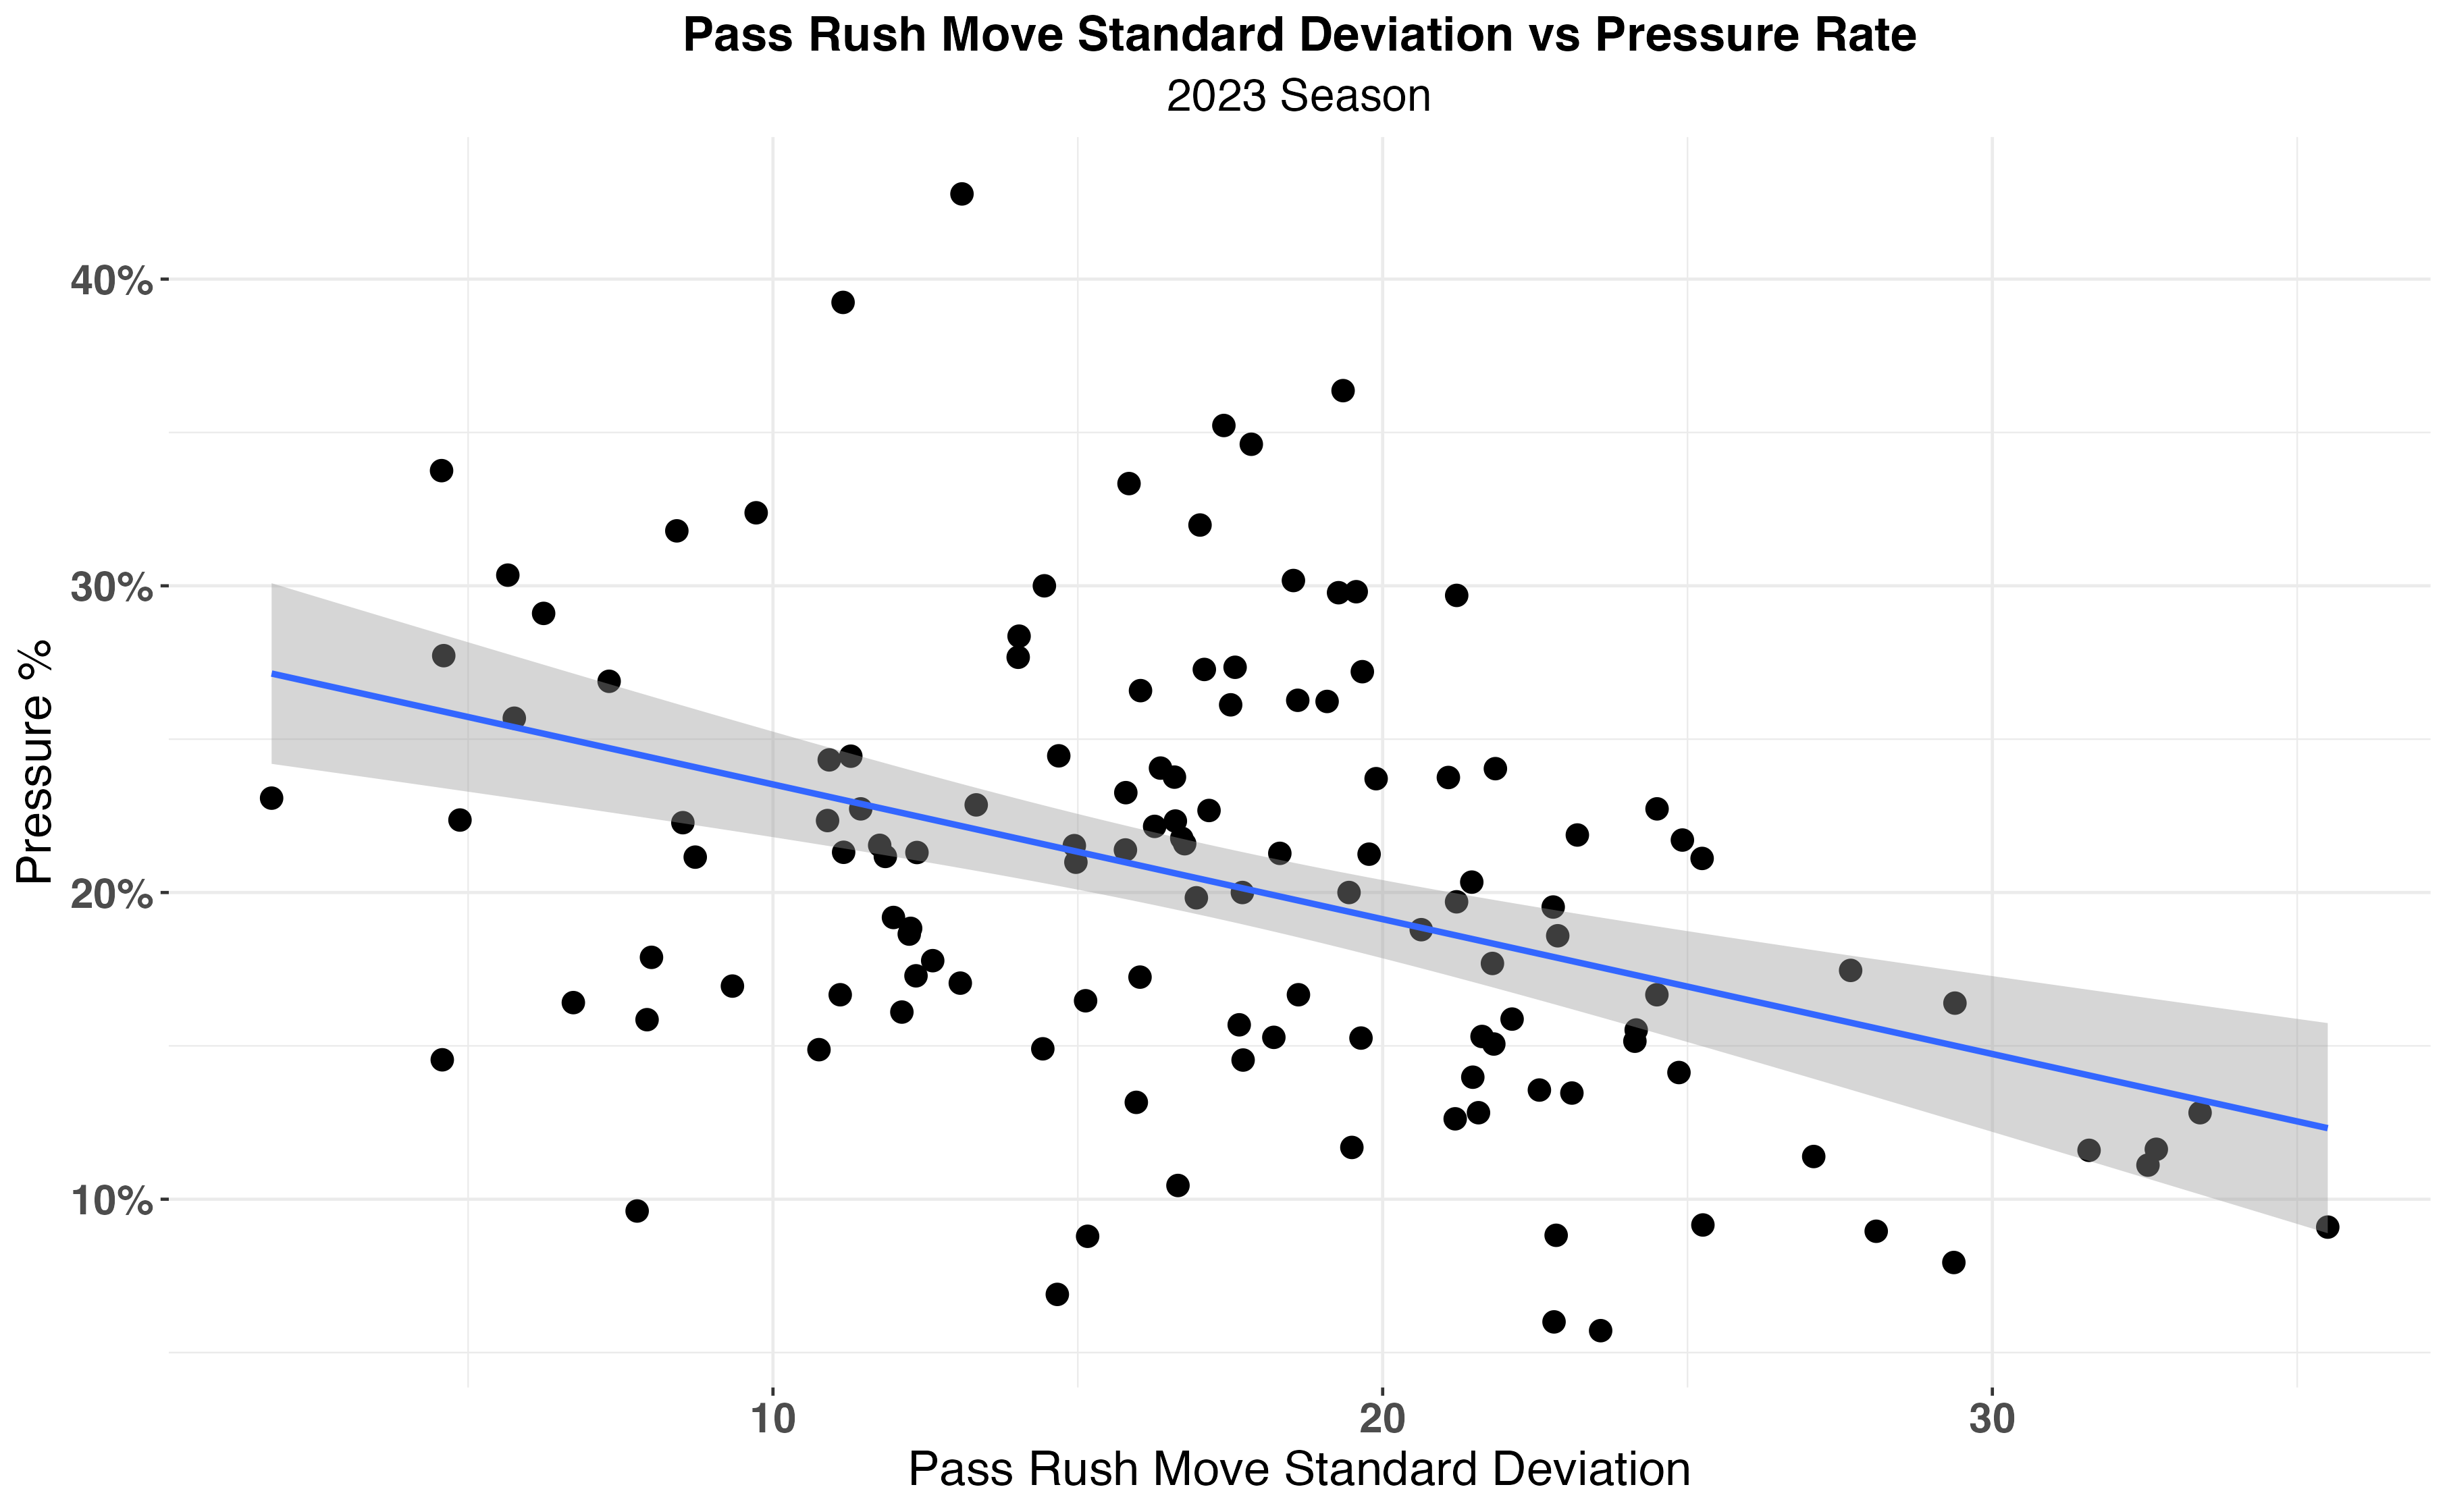
Pass Rush Move Standard Deviation and Pressure Rate have a moderately negative relationship (r = -0.41), where as standard deviation decreases (lower equals more balanced), pressure rate tends to increase and vice versa.
(R-squared = 0.17, meaning 17% of the variance in pressure rate is explained by Pass Rush Move standard deviation; p-value: 0.0000023, statistically significant)
Analyzing further, I binned the Pass Rush Move standard deviations into percentile bins and calculated the pressure rates for each bin.
sd_bins       pressure_rate
1-25 %ile     22.5
26-50 %ile    21.7
51-75 %ile    23.0
76-100 %ile   14.5
Complete balance is not necessary to be an effective pass rusher. Pass rushers just need to have a semblance of balance so they don’t become one dimensional like the bottom 25th percentile group. I think this confirms a lot of what defensive line coaches and pass rush specialists already believed to be true in terms of move mix.
Pass Rush Sequencing
The prior section is across the aggregate. I want to explore the more granular level, the sequences of rush moves throughout a game — similarly to the Bosa gifs above.
I once again borrow from baseball to calculate Pass Rush Move Type Sequence Similarity Ratio. Ajay Patel and Sean Sullivan did excellent research on pitch type sequencing by utilizing Sequence Similarity Ratio (SSR) to determine which pitchers are mixing up their pitch type sequencing. Values closer to 0 indicate a pitcher is mixing up their sequencing and values closer to 1 indicate a pitcher is matching sequences more often.
Here is a breakdown of how they compare sequences and the SSR equation from their work (which you can find here).

But baseball is a bit more straightforward than football in terms of sequencing. The ability to strategize between pitches is possible between each and every pitch of a plate appearance for a pitcher. Whereas the thought patterns for a pass rusher between downs are cloudier due to not every down being a passing down. An EDGE can’t always plan out a pass rush plan on consecutive plays because some downs have higher probabilities of being a run play than others. In those situations the EDGE is playing reactively rather than being in an attack mindset like on 3rd & long.
To account for that I used nflfastR’s Expected Pass Probability Model to see which situations had an expected pass rate of 70% or greater and filtered out plays below that criteria.
The next data issue was determining what would be football’s equivalent of a plate appearance. I originally considered using drives, but some drives are full of run heavy situations and the sample was too low. Additionally pass rushers would vary their alignment, aligning across the Left and Right Tackles throughout a single drive — defeating the purpose of what a prior move of a sequence would setup later in the drive.
I decided to define a sequence as an entire game’s worth of pass rushes in high expected pass probability situations grouped by the same opponent matchup (the blocker) from the same side of the defense (left or right). I then used the same SSR equation described earlier to calculate my results.
Here are the lowest Pass Rush Move SSR by pass rushers from the EDGE, min. 50 sequences — meaning they’re mixing their sequences the most.
player_name    ssr
Z.Collins      0.378
B.Ojulari      0.389
A.Epenesa      0.405
R.Gary         0.410
C.Jones        0.412
I wonder if diversifying rush moves throughout downs is something the Cardinals coaching staff preaches as they have the top two EDGEs in SSR.
And here are the highest Pass Rush Move SSR by pass rushers from the EDGE, min. 50 sequences — meaning they’re matching their sequences the most.
player_name ssr
V.Miller 0.576
P.Smith 0.561
G.Karlaftis 0.555
J.Uche 0.552
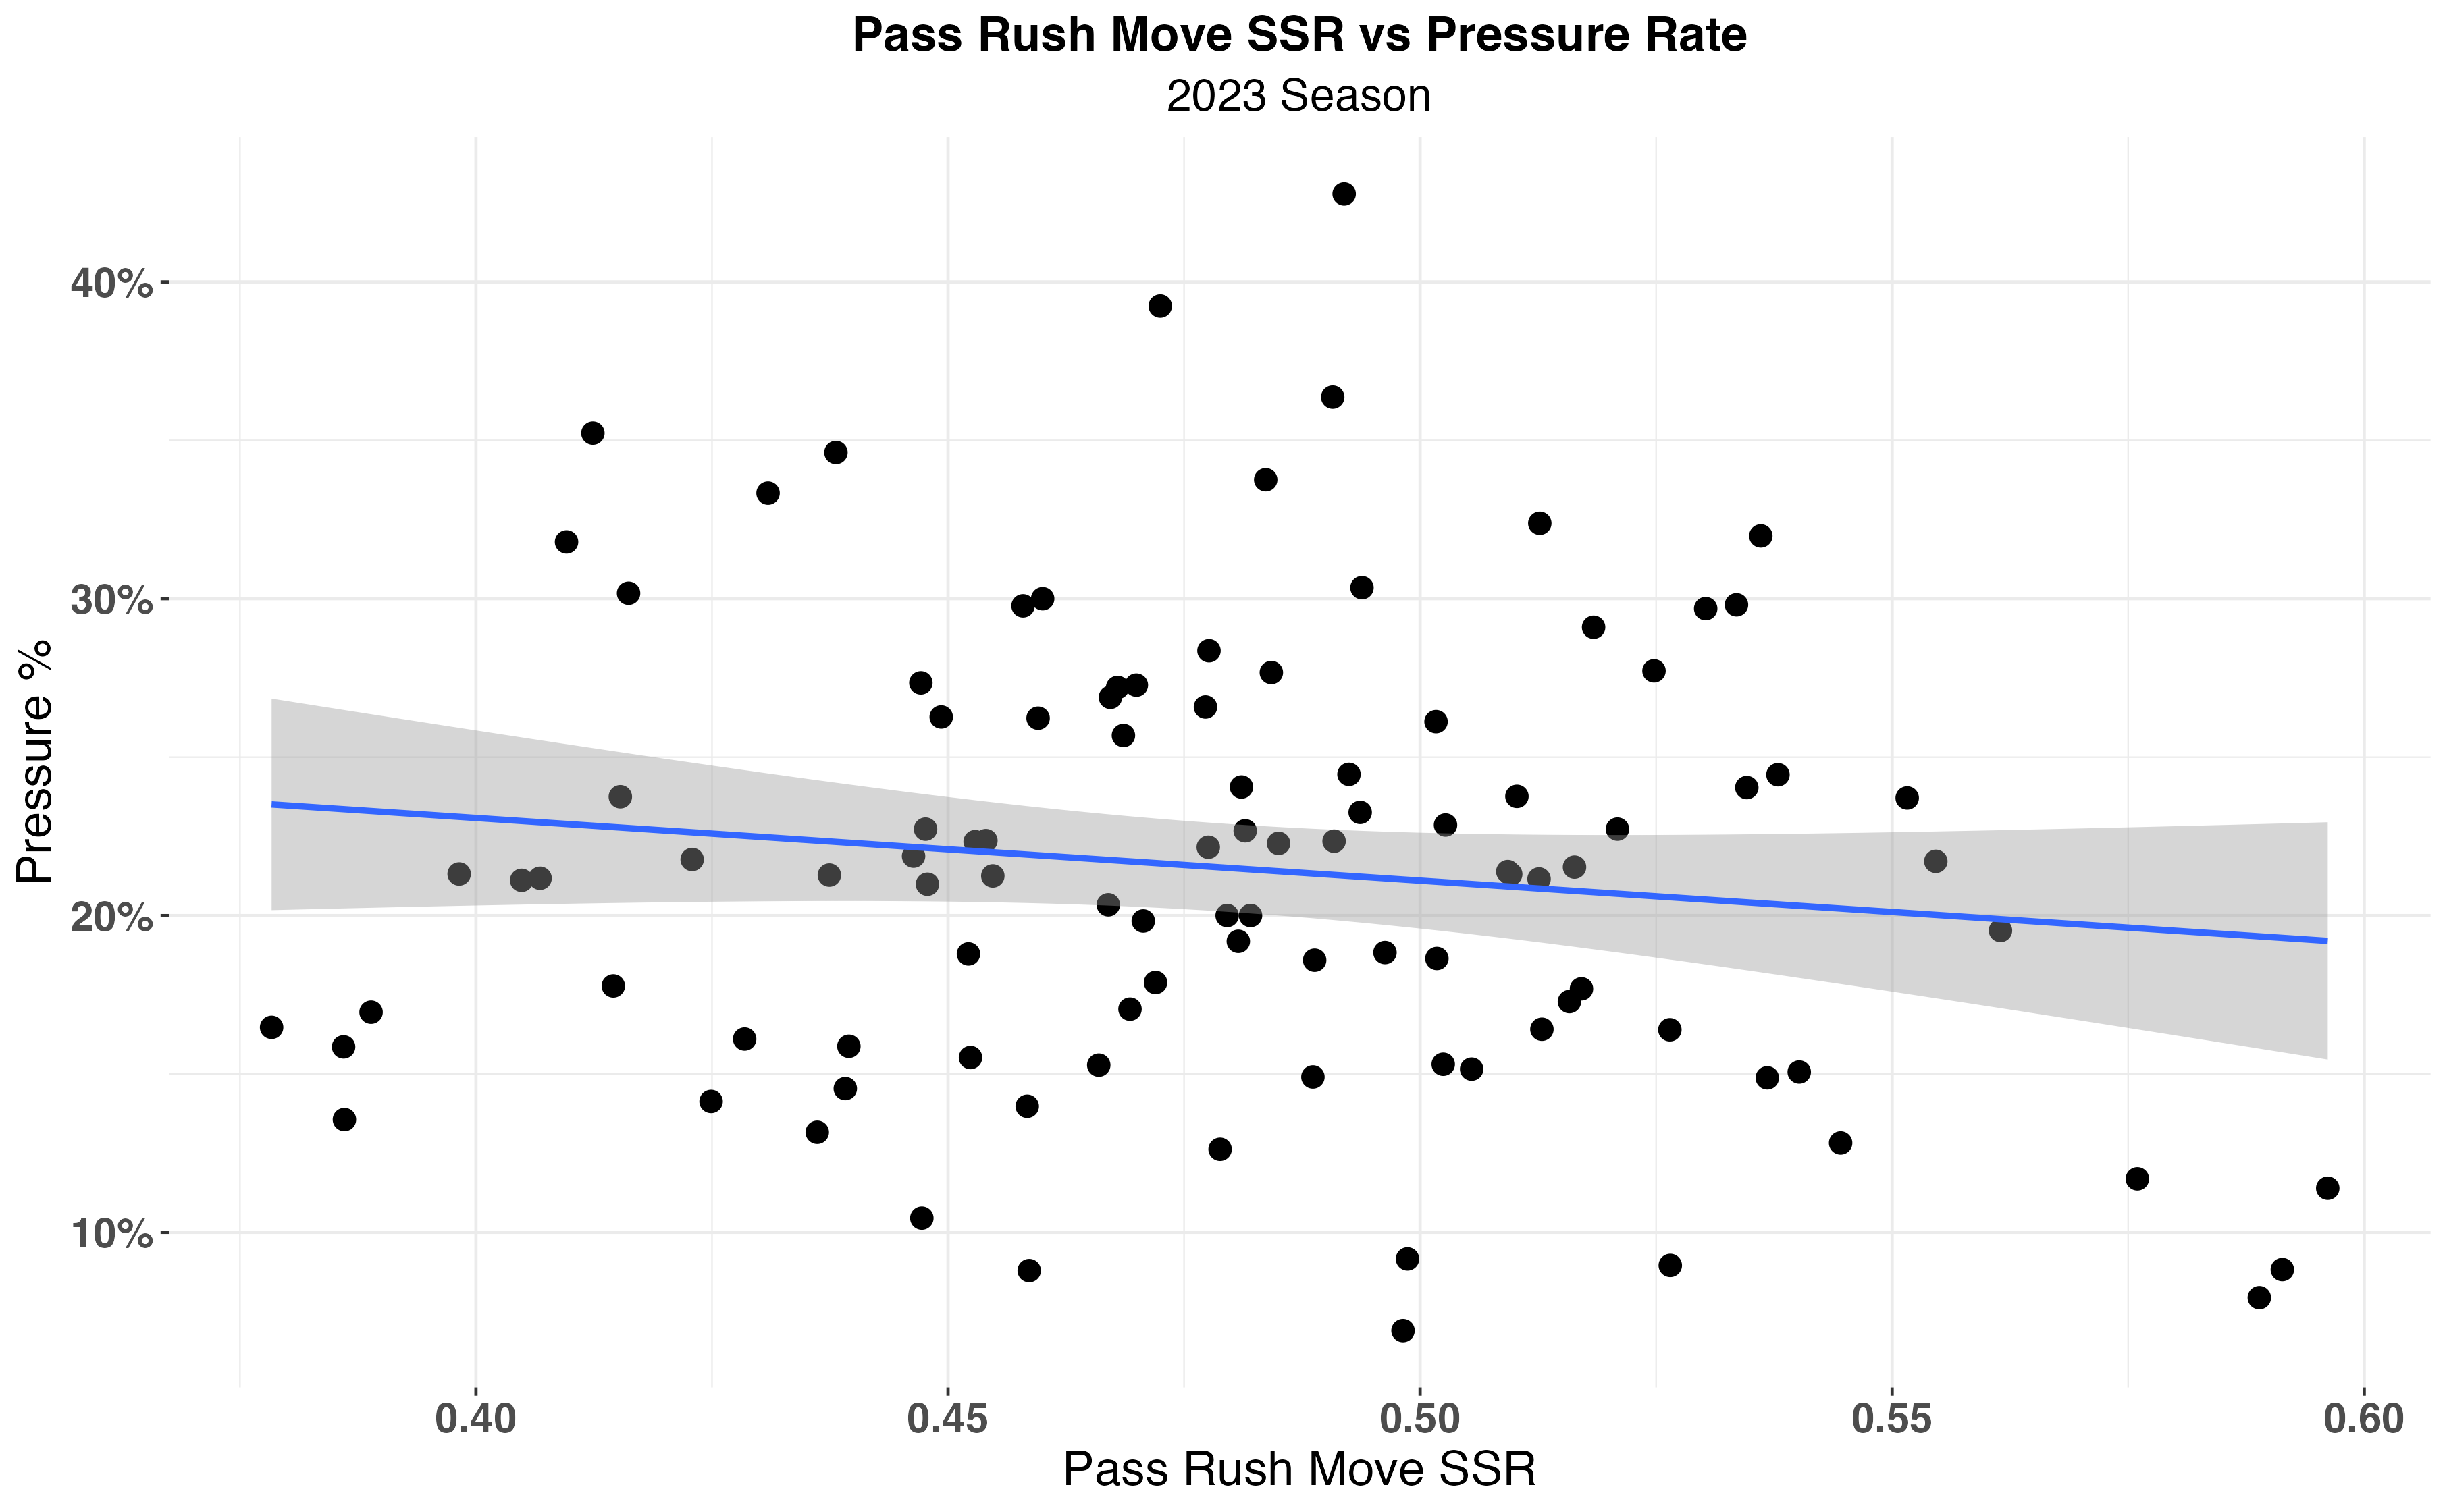
D.Taylor 0.545The results are underwhelming in terms of how Pass Rush Move SSR correlates to Pressure Rate (r= -0.13, R-squared = 0.02, p-value = 0.193 - not significant).
I’m not going to completely close the book on SSR having an impact on pressure rate. The pass rush move categories I’m working with are lacking level of detail compared to what baseball has available. Outside, Inside, and Bullrush moves are like using only Fastball, Off-speed, and Breaking Ball as pitch categories. Within the fastball category alone you have four-seamers (rising action), sinkers (downward action), and cutters (horizontal break). A pass rusher who utilizes inside moves often could have a sequence of a rip, spin, and swim. But my model wouldn’t be able to pick up that level of granularity at this time and ends up categorizing them as all the same.
With that said, the sequencing research might still have use for advance scouting purposes. Knowing what moves pass rushers use the most sequentially in expected pass situations can be useful information for an offensive tackle.
Using Bosa as the example for a note — In high pass probability situations Bosa’s most used 2-move subsequence are Bullrush, Inside and Inside, Inside at 15 times each. His most used 3-move subsequences are Inside, Inside, Inside (8) and Inside, Outside, Inside (6).
At some point this week I’ll do a deep dive into an individual pass rusher as if I was helping an Offensive Line coach prepare for their Week 1 matchup.