
Lateral Bite Distance: The Second Dimension to Quantifying Bite Distance on Play-Action
A new metric to add context to vertical bite up distance


Player tracking data has improved NFL analyst’s ability to quantify elements of football that were once unmeasurable. In recent years analysts like Joe Andruzzi (Defender Bite Velocity) and Eric Eager Et al. (Bite Distance Under Expected) have created metrics using tracking data to quantify how linebackers react to play-action passes. Both Defender Bite Velocity and BDUE effectively measure the vertical element or how a defender ‘bites up’ toward the line of scrimmage against play-action.
Manipulating linebackers in coverage by forcing them to move closer to the line of scrimmage is an important element of play-action as this allows receivers to work the second level areas of the field that are left vacated as a result of the deception. But the other dimension in measuring whether or not the play-action fake successfully fooled a linebacker is how the fake moved the linebacker laterally, or side-to-side.
With Kyle Shanahan, Sean McVay, and their disciples influencing offenses throughout the league by utilizing wide zone play-action schemes, linebackers are being stretched horizontally in addition to vertically.
The main goal of an outside zone run is to stretch the defense horizontally to find a gap in the defense to run through. On it’s own the outside zone run is a solid play, but what makes the entire scheme effective is the additional elements an offense can attach to the play that helps deceive the defense (jet motion, play-action, screens, etc.).
To showcase how the wide zone scheme works and influences off-ball linebackers, let’s look at the 2020 Rams use of play-action attached to an outside zone run concept followed by an outside zone run play within the same offensive series.
Play-Action with Outside Zone Run Fake (+22 yard gain)
In the first play the Cowboys defense knows the Rams are a heavy outside zone run team. On 1st & 10 with the QB aligned under center a run to start the season seems likely. But as McVay often does, he plays off this tendency by using play-action. The Rams motion the left wide receiver across the formation to the right at the snap and the offensive line all zone block laterally to the right with the right wide receiver working across the flow on a flat route. The play fake and the OL flow force the LBs to laterally move to the right despite the intended target going to the left leading to an explosive play.
Outside Zone Run (+4 yard gain)
On the next play of the game the Rams show a similar offensive look. This time they motion the right wide receiver to the left side of the formation at the snap and the QB hands the ball off for a four yard gain.
Play sequencing and the ability to run different play calls from the same look are what make the outside zone scheme one of the most efficient and difficult schemes to prepare for — each play works off another to setup the next one to keep the defense guessing.
This puts a lot of stress on a defense’s off-ball linebackers or second level defenders and is a main reason I wanted to look into lateral bite distance.
Methodology
For those not interested in the model building process skip ahead to the next section!
The data sources used in this project are NFL Next Gen Stats tracking data from the 2023 Big Data Bowl (Weeks 1-8, 2021 season), PFF charting data, and nflreadr.
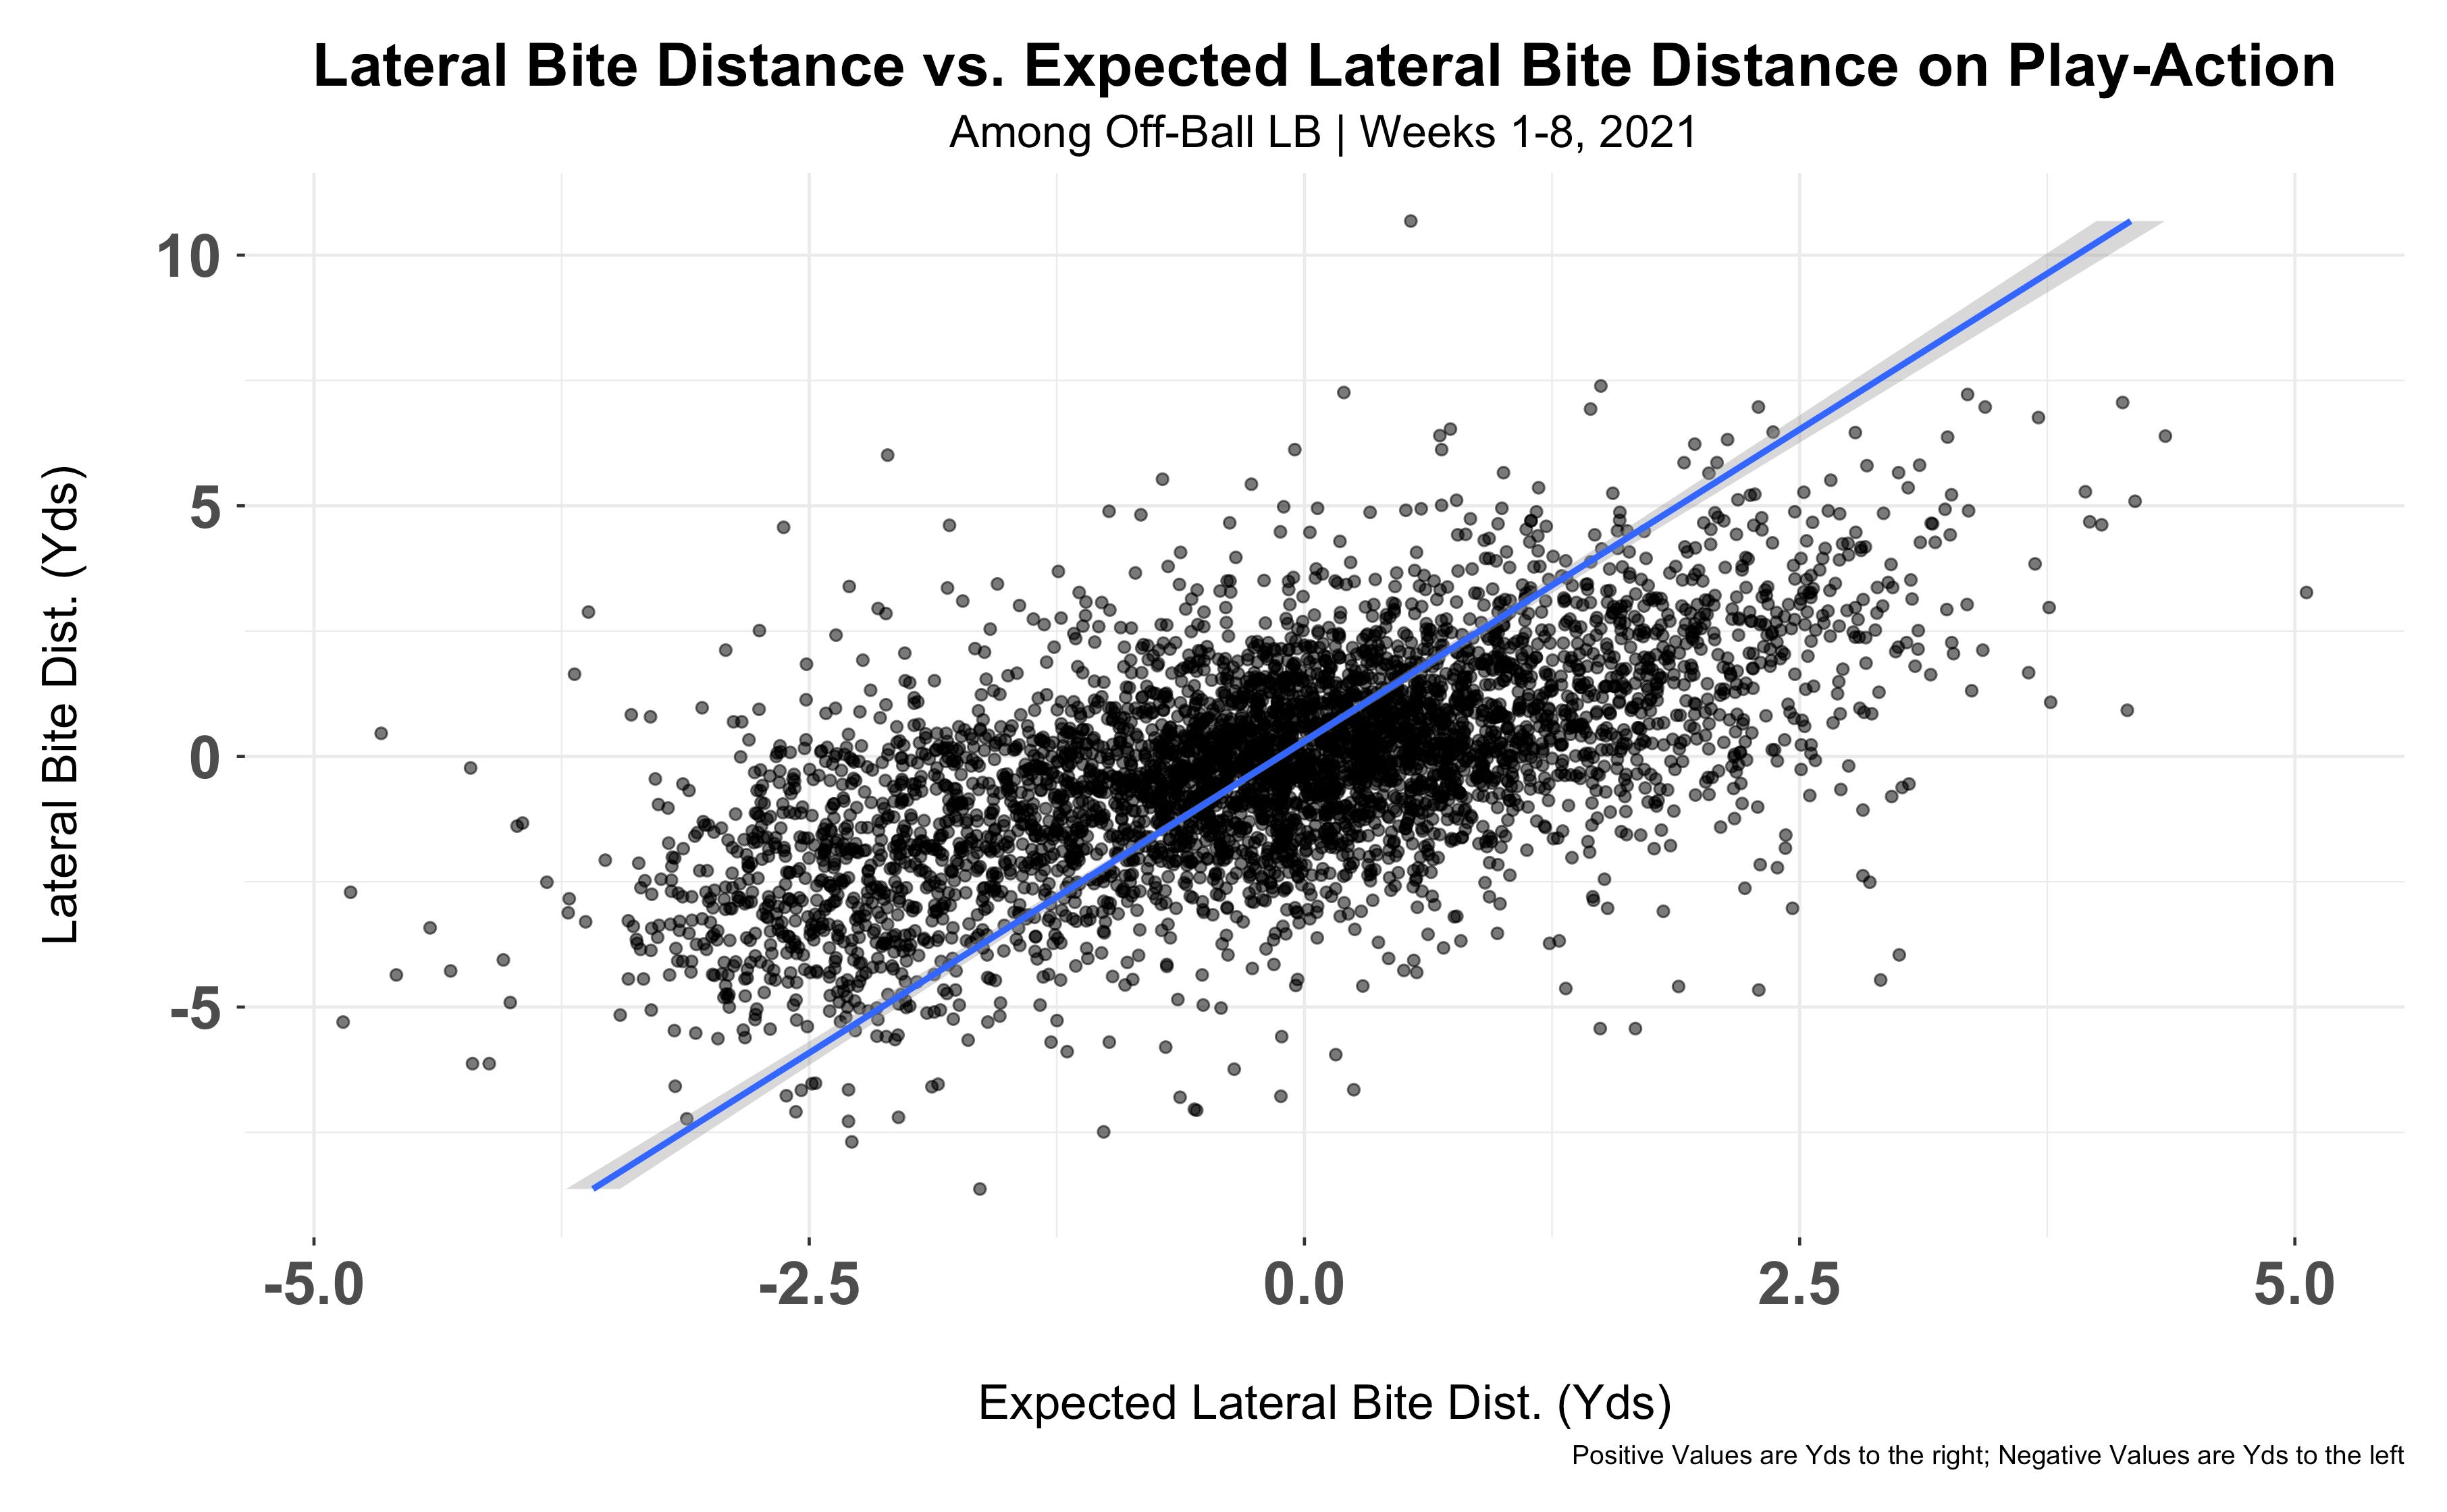
To create the dependent variable, lateral bite distance, I took the off-ball linebacker’s (a player designated as MLB, LLB, RLB, LILB, or RILB according to PFF) y-coordinate at the snap and subtracted the off-ball linebacker’s minimum and maximum y-coordinate 0.5 seconds after the play-action event occurred in the tracking data. Because lateral bite distance is, well, lateral, and a LB can move left or right, I had to take the difference between the LB’s minimum y-coordinate and maximum y-coordinate within this post-snap time frame. This gives a LB two bite distance figures on a play-action attempt — 1. their most yards moved toward the left and 2. their most yards moved toward the right on a play. A negative lateral bite distance indicates a LB moved to the left and a positive indicates a LB moved to the right. To pick one lateral bite distance figure I took the greater absolute value of the two figures unless there was offensive line movement that impacted the LB’s movement. I’ll explain that feature more in a second. But I made this exception due to the potential for LB to bite laterally in one direction initially due to the OL flow but recover. While recovering is a positive, I want to measure the distance a LB bit laterally, even if the player corrected himself later in the play.
I then began selecting features for the model and creating variables that I thought would improve the model’s performance. Using the tracking data I created an OL Flow variable by taking the offensive tackles y-coordinate at the snap and their y-coordinate at the time of the play-action event. The difference of those points for the left and right tackles can then determine if the OL is working in unison; left and right tackle with negative differences between their y-coordinates at the snap and play-action event are considered to have left OL flow, while two positives are considered to have right OL flow. If the right and left tackle are not moving in the same direction then the OL is considered to have no flow.
Linebackers are often taught to read an offensive lineman, like a guard, through the ball carrier. Using this domain knowledge it makes sense to create a variable that can depict the flow of the OL and see if that has any impact on a LB’s post-snap movement.
In addition to OL Flow, I included the run concept attached to the play-action fake by the offense on the play, quarter, down, yards to go, yard-line number, score differential, QB alignment (under center, shotgun, pistol), motion, pre- and post-snap safety shell, defenders in the box, previous play type (run or pass), previous run concept, and a LB’s x, y coordinates at the snap.
I then included those features in an xgboost model with a 8-fold cross validation to predict lateral bite distance for off-ball linebackers — xLateral Bite Distance.
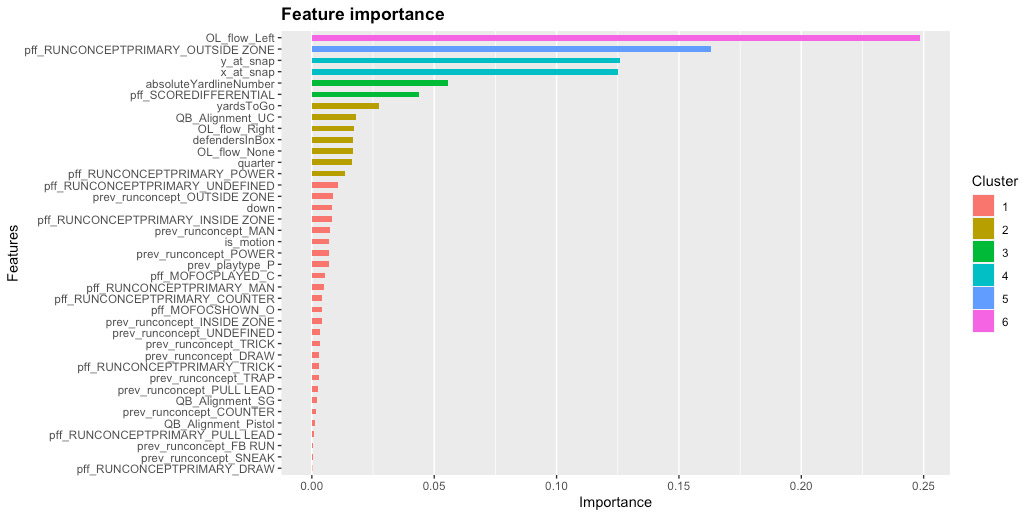
The most important features in the xLateral Bite Distance model is OL Flow to the left and whether or not outside zone is the run concept, followed by the LB’s x, y coordinates at the snap. It is to be noted that OL flow to the right is in the fourth cluster of importance and it is likely due to the volume in which teams flow to the left compared to the right. This is likely because when a team runs play-action with an outside zone run fake it will roll the QB to the opposite side of the fake. Most NFL QBs are right hand dominant and it’s easier for a QB to roll and throw to his right than shift his weight, create trunk rotation, and square his shoulders rolling left.
Other notable features include the area on the field, score differential, yards to go, QB aligning under center, power runs, quarter, defenders in the box, and the previous run concept being outside zone. These features high importance signal that the threat of running the ball has an impact on play-action success in terms of moving off-ball LBs laterally.
Metrics created with lateral bite distance and xLateral Bite Distance include Lateral Bite Distance Over Expected and Lateral Bite Distance MSE. Due to the nature of lateral bite distance indicating a left or right direction it is difficult to obtain a residual metric without grouping the data by the expected direction the LB was predicted to move based on the model features. Additionally, like xPassRush, xLateral Bite Distance figures can be negated. For example, if a LB moves -4 yards (moving left) on one play and 4 yards (moving right) on another play, the LB’s average lateral bite distance would be 0 — as if they never moved on either play at all. Because of this I took the absolute values for lateral bite distance and xLateral Bite Distance. But this causes an issue with the Over Expected metric as when you convert to absolutes all the figures will be positive. So if I want to use an OE metric I’ll have to group by expected direction. Otherwise I use the Mean Squared Error (MSE) to measure how a LB or team did relative to expectation.
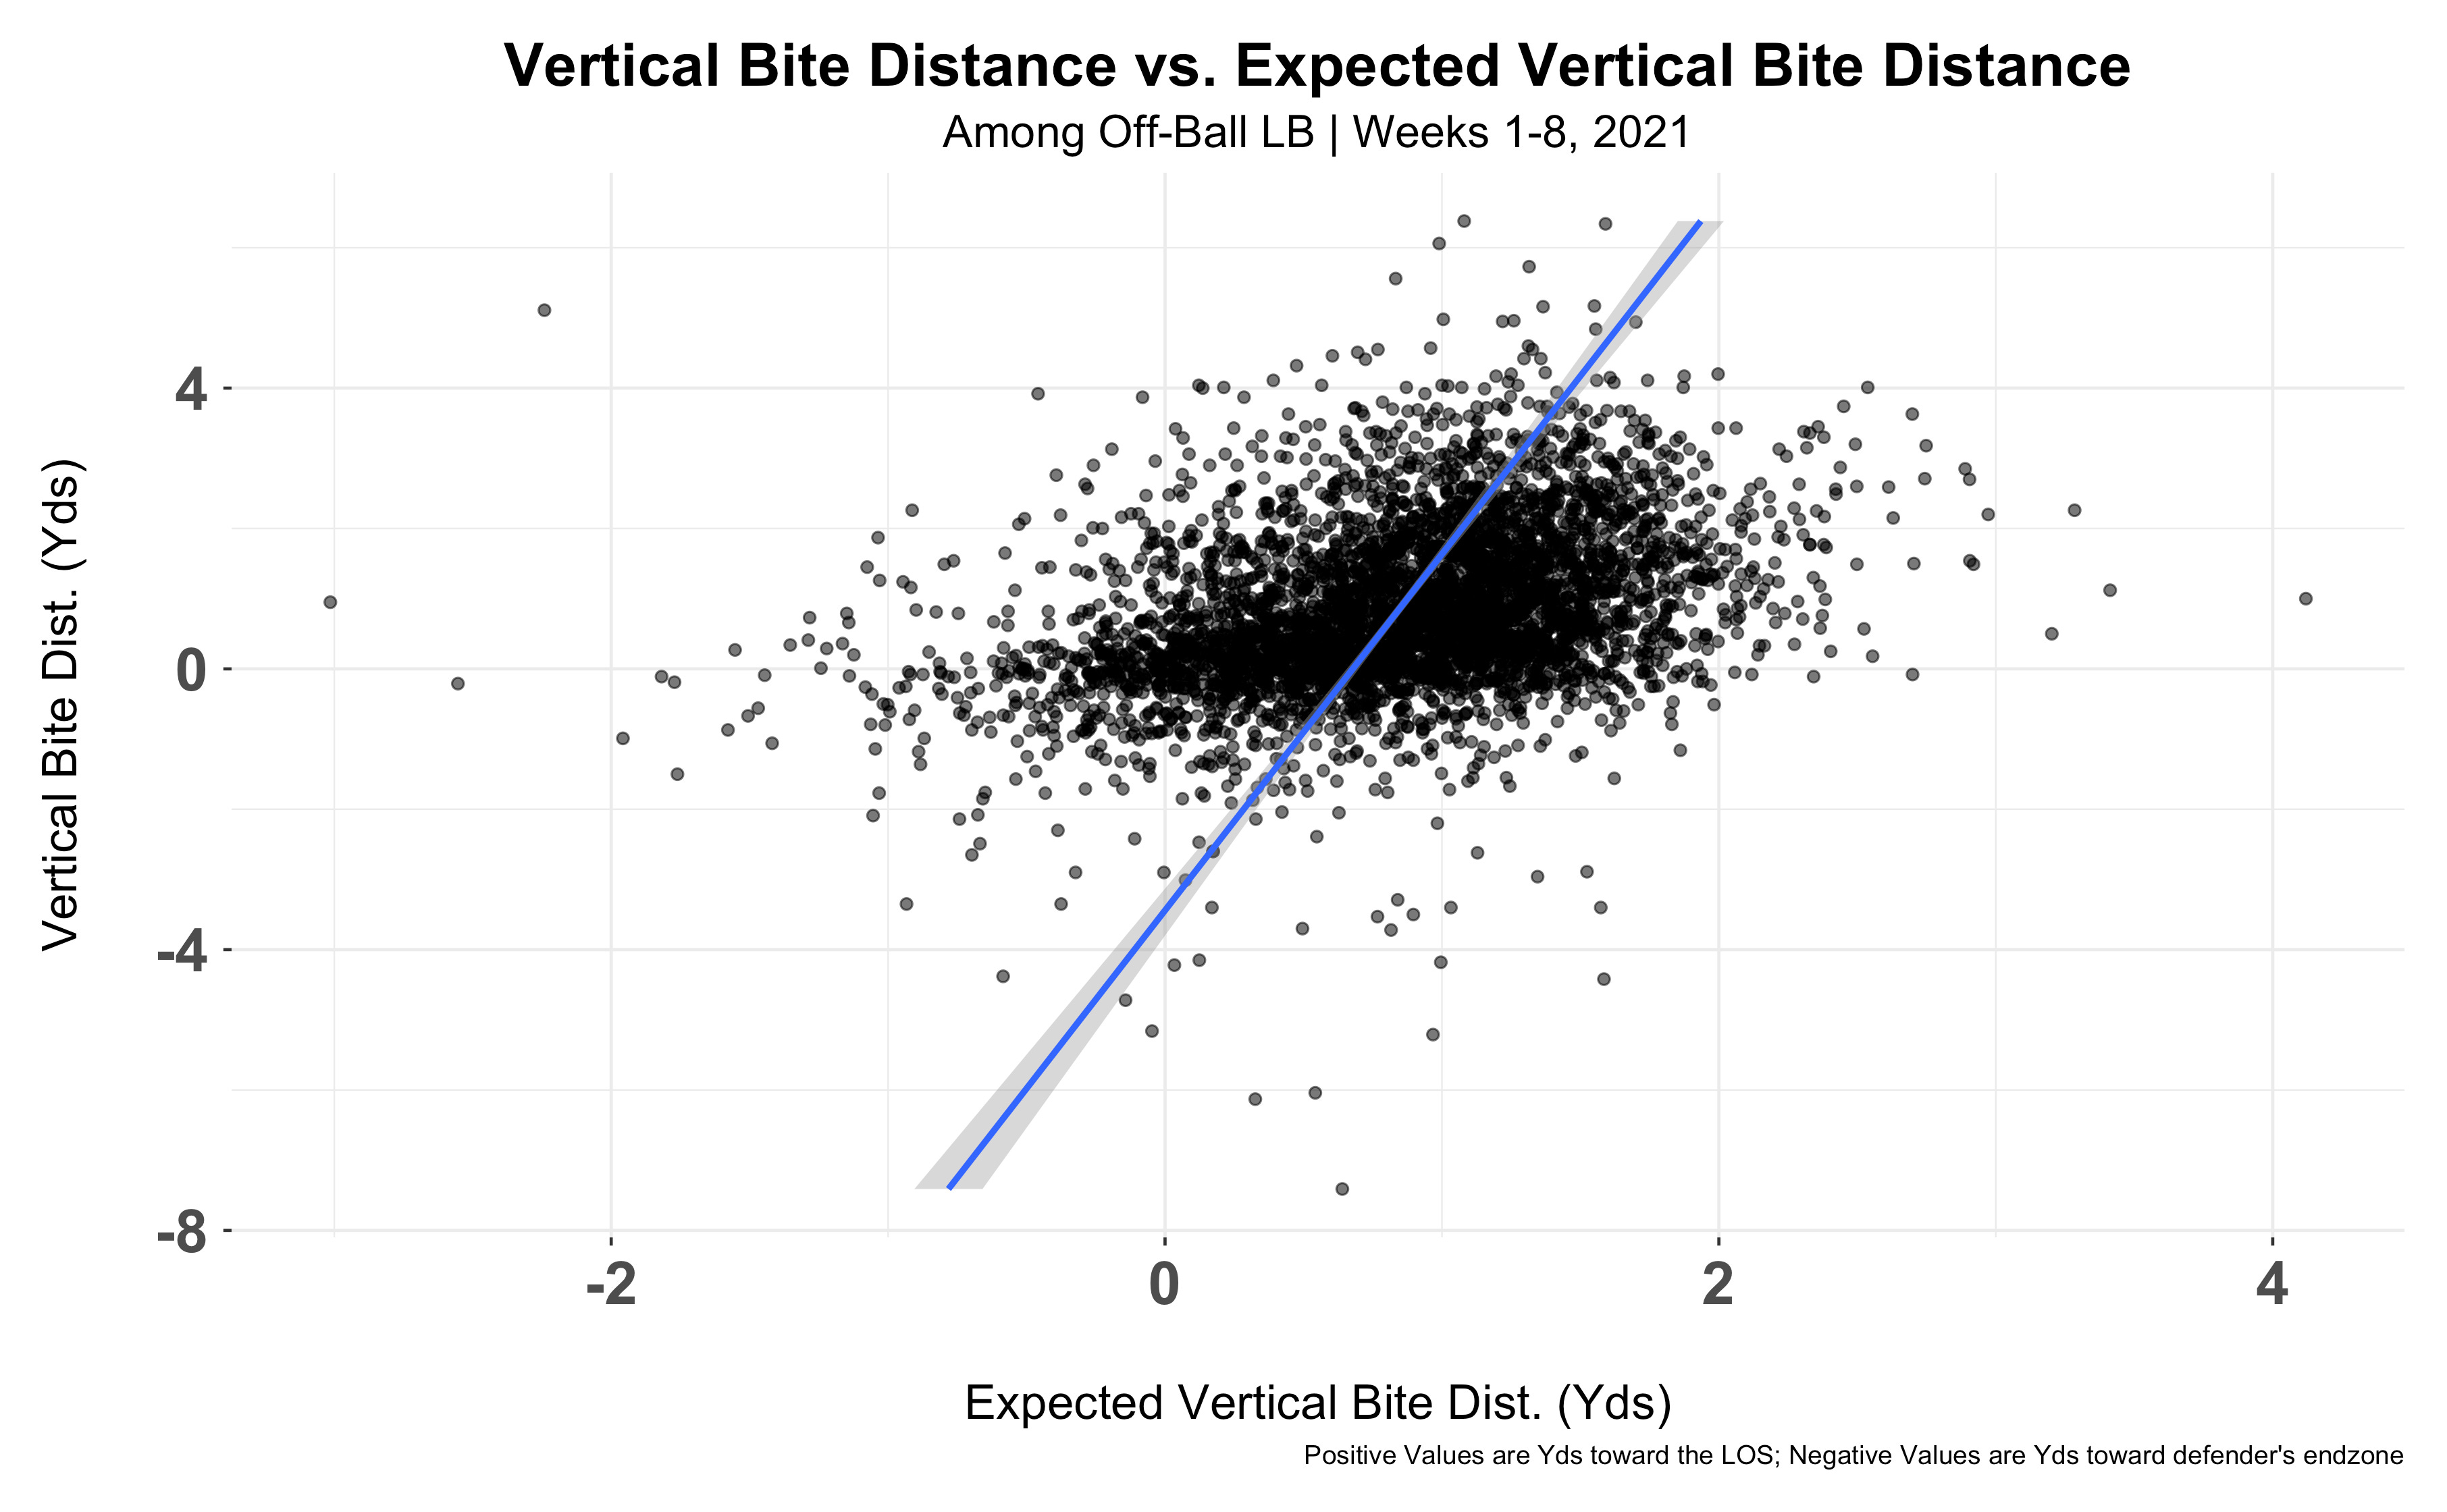
Next, I created an expected vertical bite distance model (xVertical Bite Distance) to pair with the xLateral Bite Distance model for the analysis portion of the project. The features and techniques were largely the same but the dependent variable is different.
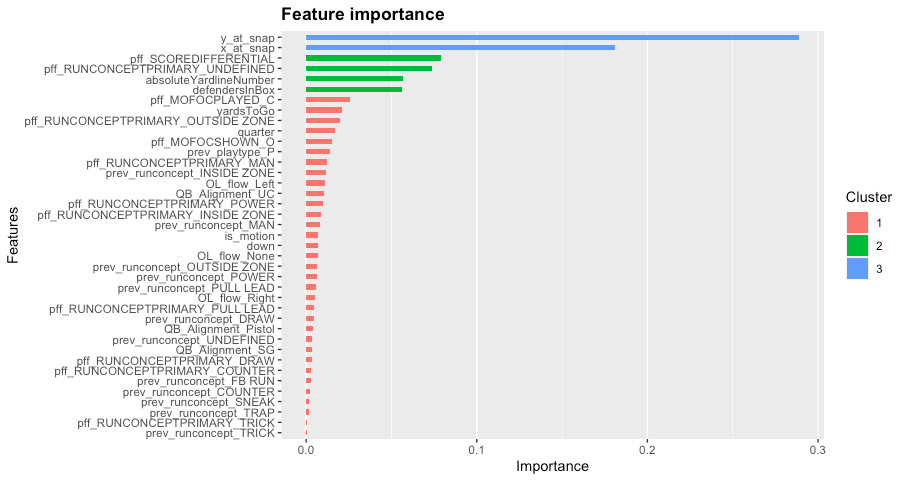
The xVertical Bite Distance model’s most important features are the LB’s x, y coordinates at the snap followed by some of the secondary important features of the xLateral Bite Distance model. One interesting feature that has some importance is when a defense plays Middle of Field Closed coverage. MOFC coverages have an extra defender in the equation to help fit the run compared to MOFO coverages.
Both expected models correlate fairly well with the actual results considering the difficulty of the problem. I also compared the model’s RMSE to that of naive models and other models with differing features to assess performance.
I was fortunate to be able to compare my results for the vertical bite distance model with Eager and Tej Seth’s results from their recent paper studying LB bite distance under expected and had similar individual player results atop the leaderboard despite differing methods in creating the target variable. This bodes well for the vertical model as Eager and Seth’s work proved to have year-to-year stability and improvement among established LB coverage metrics. I cannot test the former with only a half season of data. Overall, one major limitation of this data set is the lack of observations and with more data these models can be improved upon.
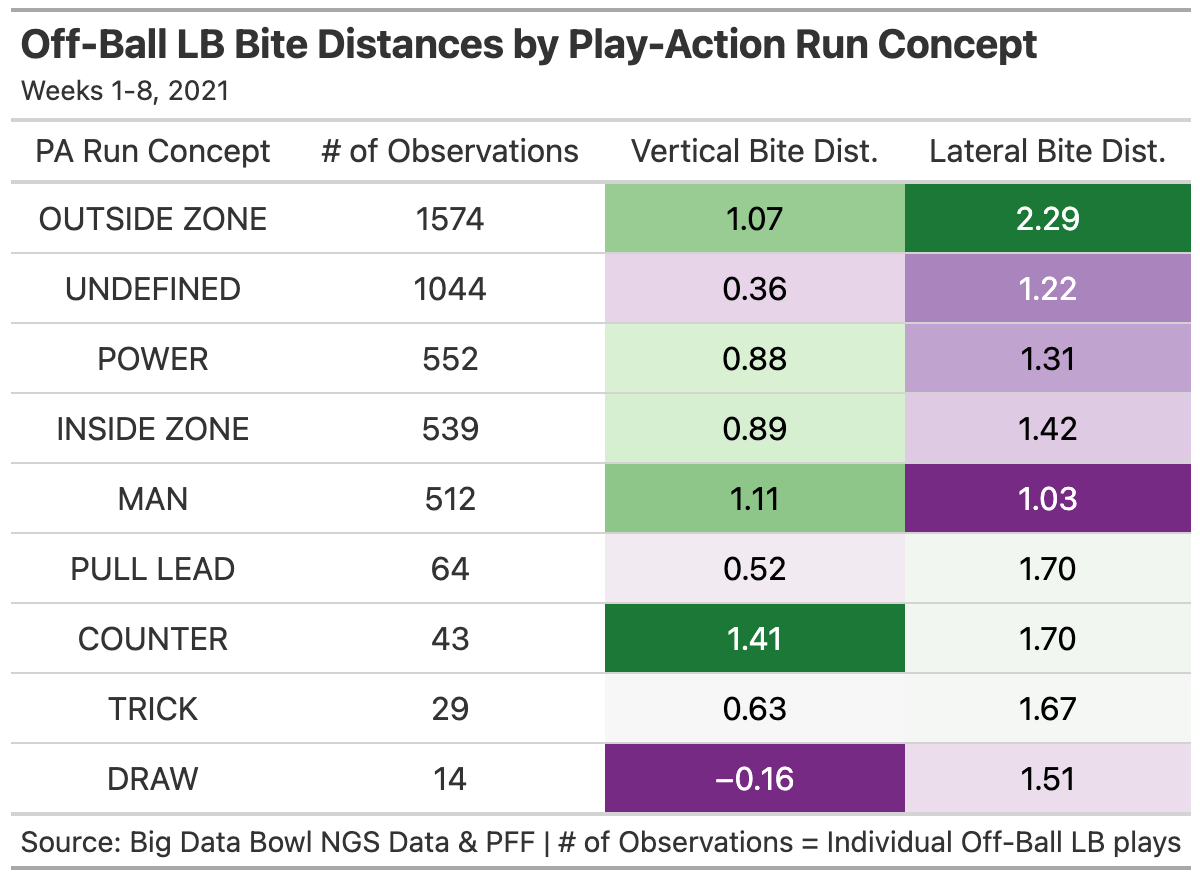
How Attached Run Scheme Impacts Play-Action
This next table confirms why teams have hired coaches who use outside zone runs schemes and pair the run concept fake to their play-action passes. Play-action paired with outside zone has the perfect blend of moving LBs laterally and creating “bite” towards the line of scrimmage as the scheme creates the most lateral bite distance (2.29 yards) and the third most vertical bite distance (1.07 yards) by off-ball LB among charted run concepts by PFF. The success of outside zone should be weighed heavily in comparison to other run schemes as it has nearly three times as many LB observations than the next defined play-action run concept (power - 552). Although a limited sample, I’m intrigued by play-action paired with counter run schemes, especially for getting LBs to bite toward the LOS.
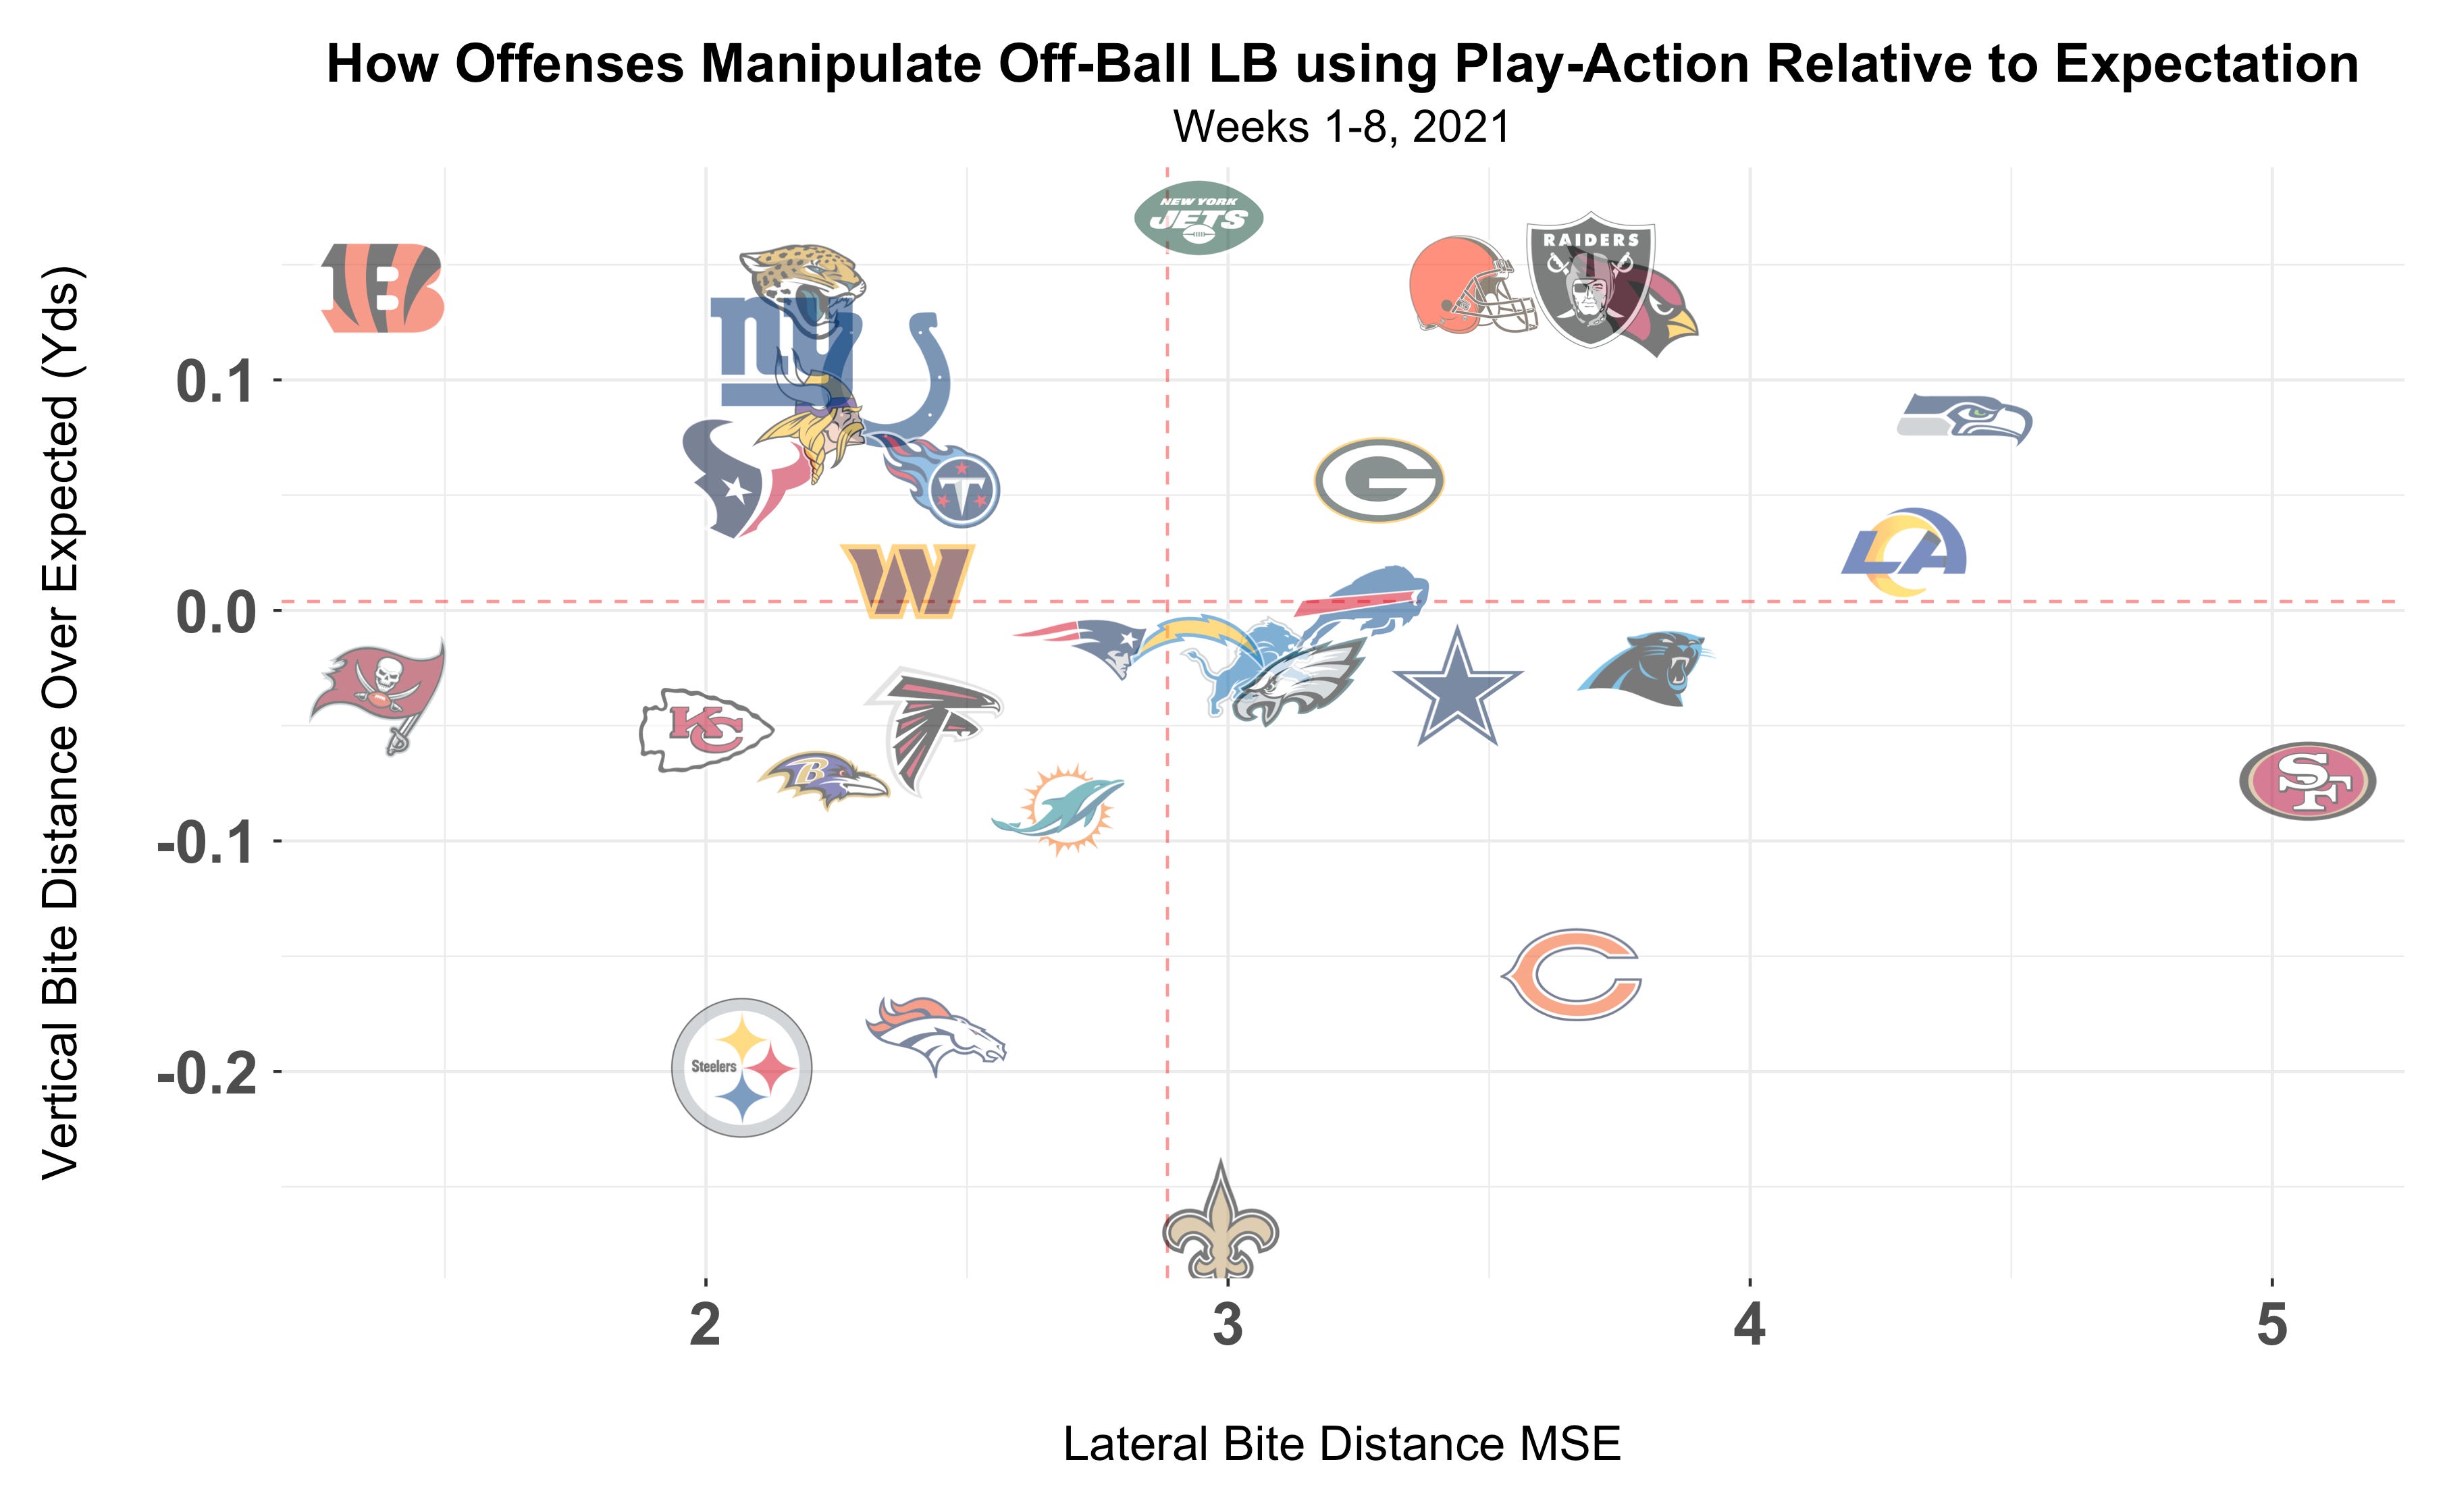
How Offenses Manipulate Off-Ball LB
By plotting an offense’s average lateral bite distance and vertical bite distance against we can determine how certain teams try to manipulate opposing LB.
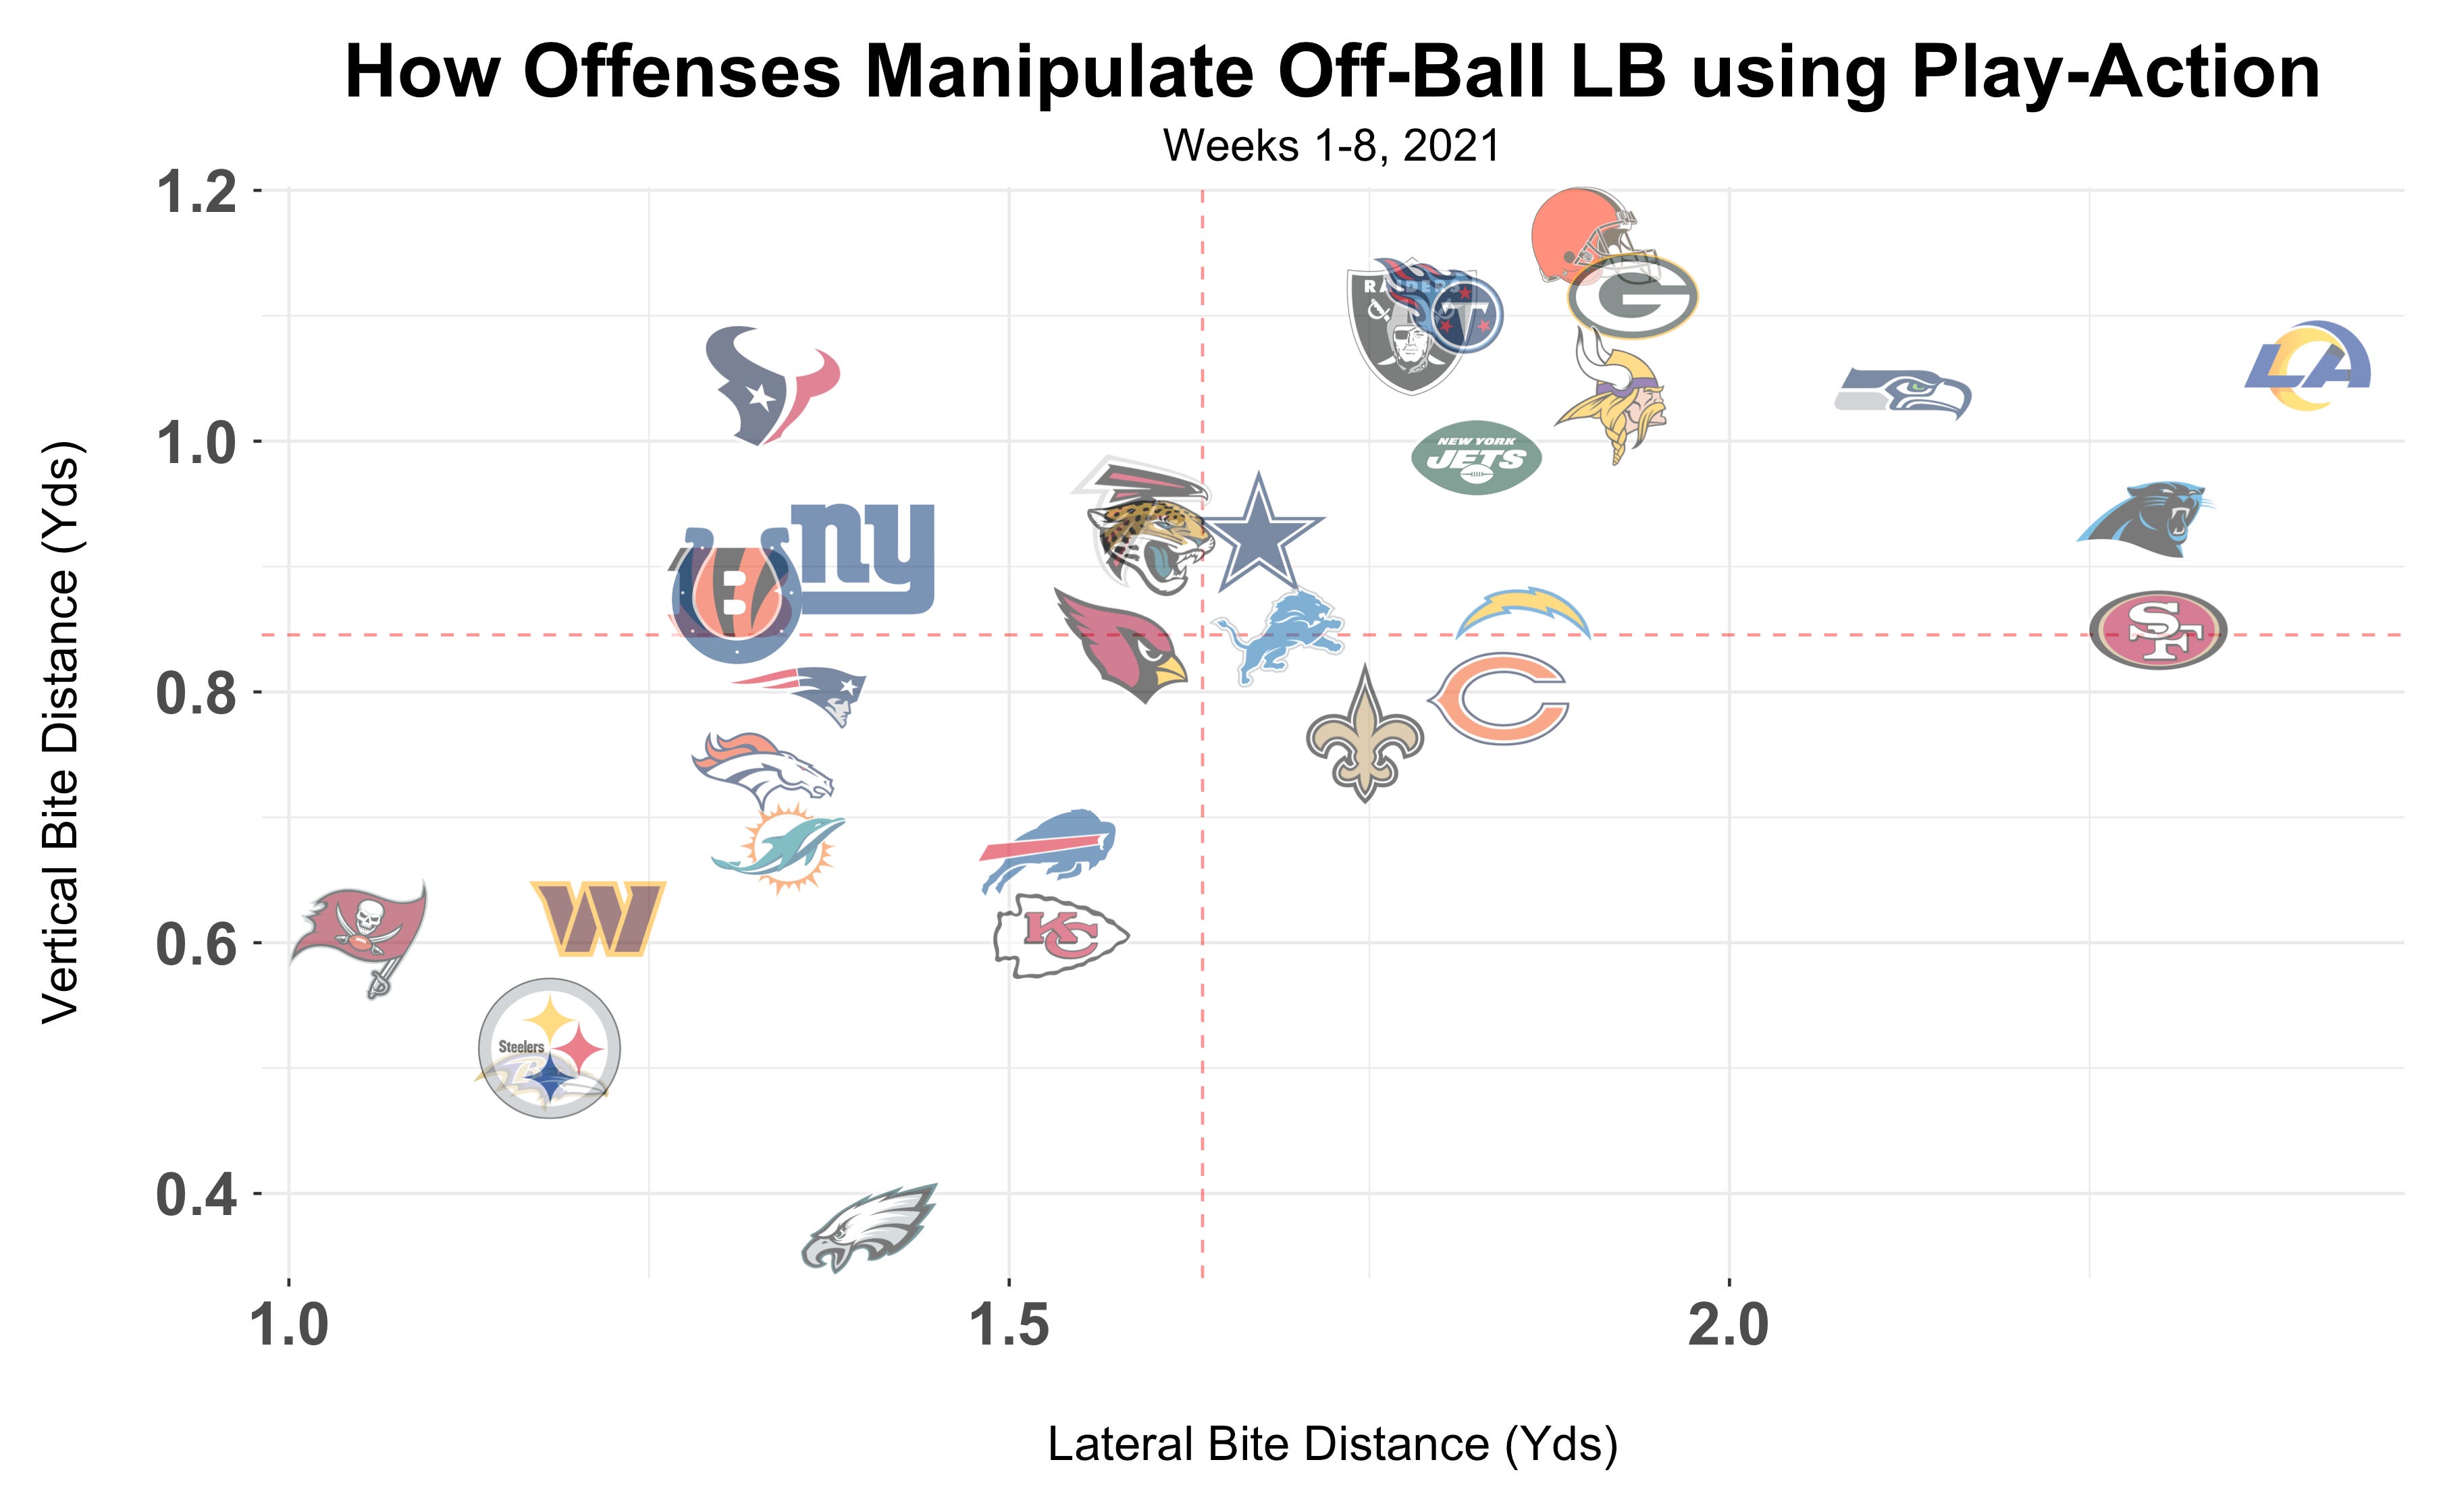
In the top right corner of the figure above are teams that can get LBs to bite up on play-action and move laterally. It’s good to see outside zone teams like the Rams (McVay), 49ers (Shanahan), Seahawks (Waldron), Packers (LaFleur), Jets (LaFleur), and Browns (Stefanski) in this quadrant in addition to the Vikings and Titans who have used outside zone schemes with previous offensive coordinators. In the bottom right corner, which is essentially empty, are the teams that create lateral bite distance, but below average bite up distance. In the top left corner are teams that move LBs toward the LOS, but do not rely on lateral movement to create space in the play-action game — likely man run scheme teams. And the lower left quadrant are the teams that struggle to move LBs at all compared to league average.
Here is the same plot but relative to expectation.
The 49ers moved LBs laterally more relative to expectation compared to the rest of the league but were below expected in terms of getting LBs to bite up on play-action. SF opened the first half of the 2021 season by beginning 3-4 with a 0.10 EPA/play on play-action passes (22nd in NFL). This improved to 0.38 EPA/play on play-action passes (2nd in NFL) in the second half of the season. But without the tracking data from the second half of the season it’s difficult to assess if they improved their bite distance over expected. Eager and Seth’s work note that SF was 31st in their BDUE metric, so, it is likely they did not improve in that metric in my analysis as well and relied on manipulating LBs with lateral movement to succeed.
That is to say based off the data there is not much of a relationship between bite distance over expected and EPA/play. It’s stronger than lateral bite distance but I believe there are multiple ways to succeed using play-action while moving LBs — and SF is a testament to that.
How Defense’s Off-Ball LB React to Play-Action
Now for the defensive side of the ball — how team’s LB corps respond to play-action.
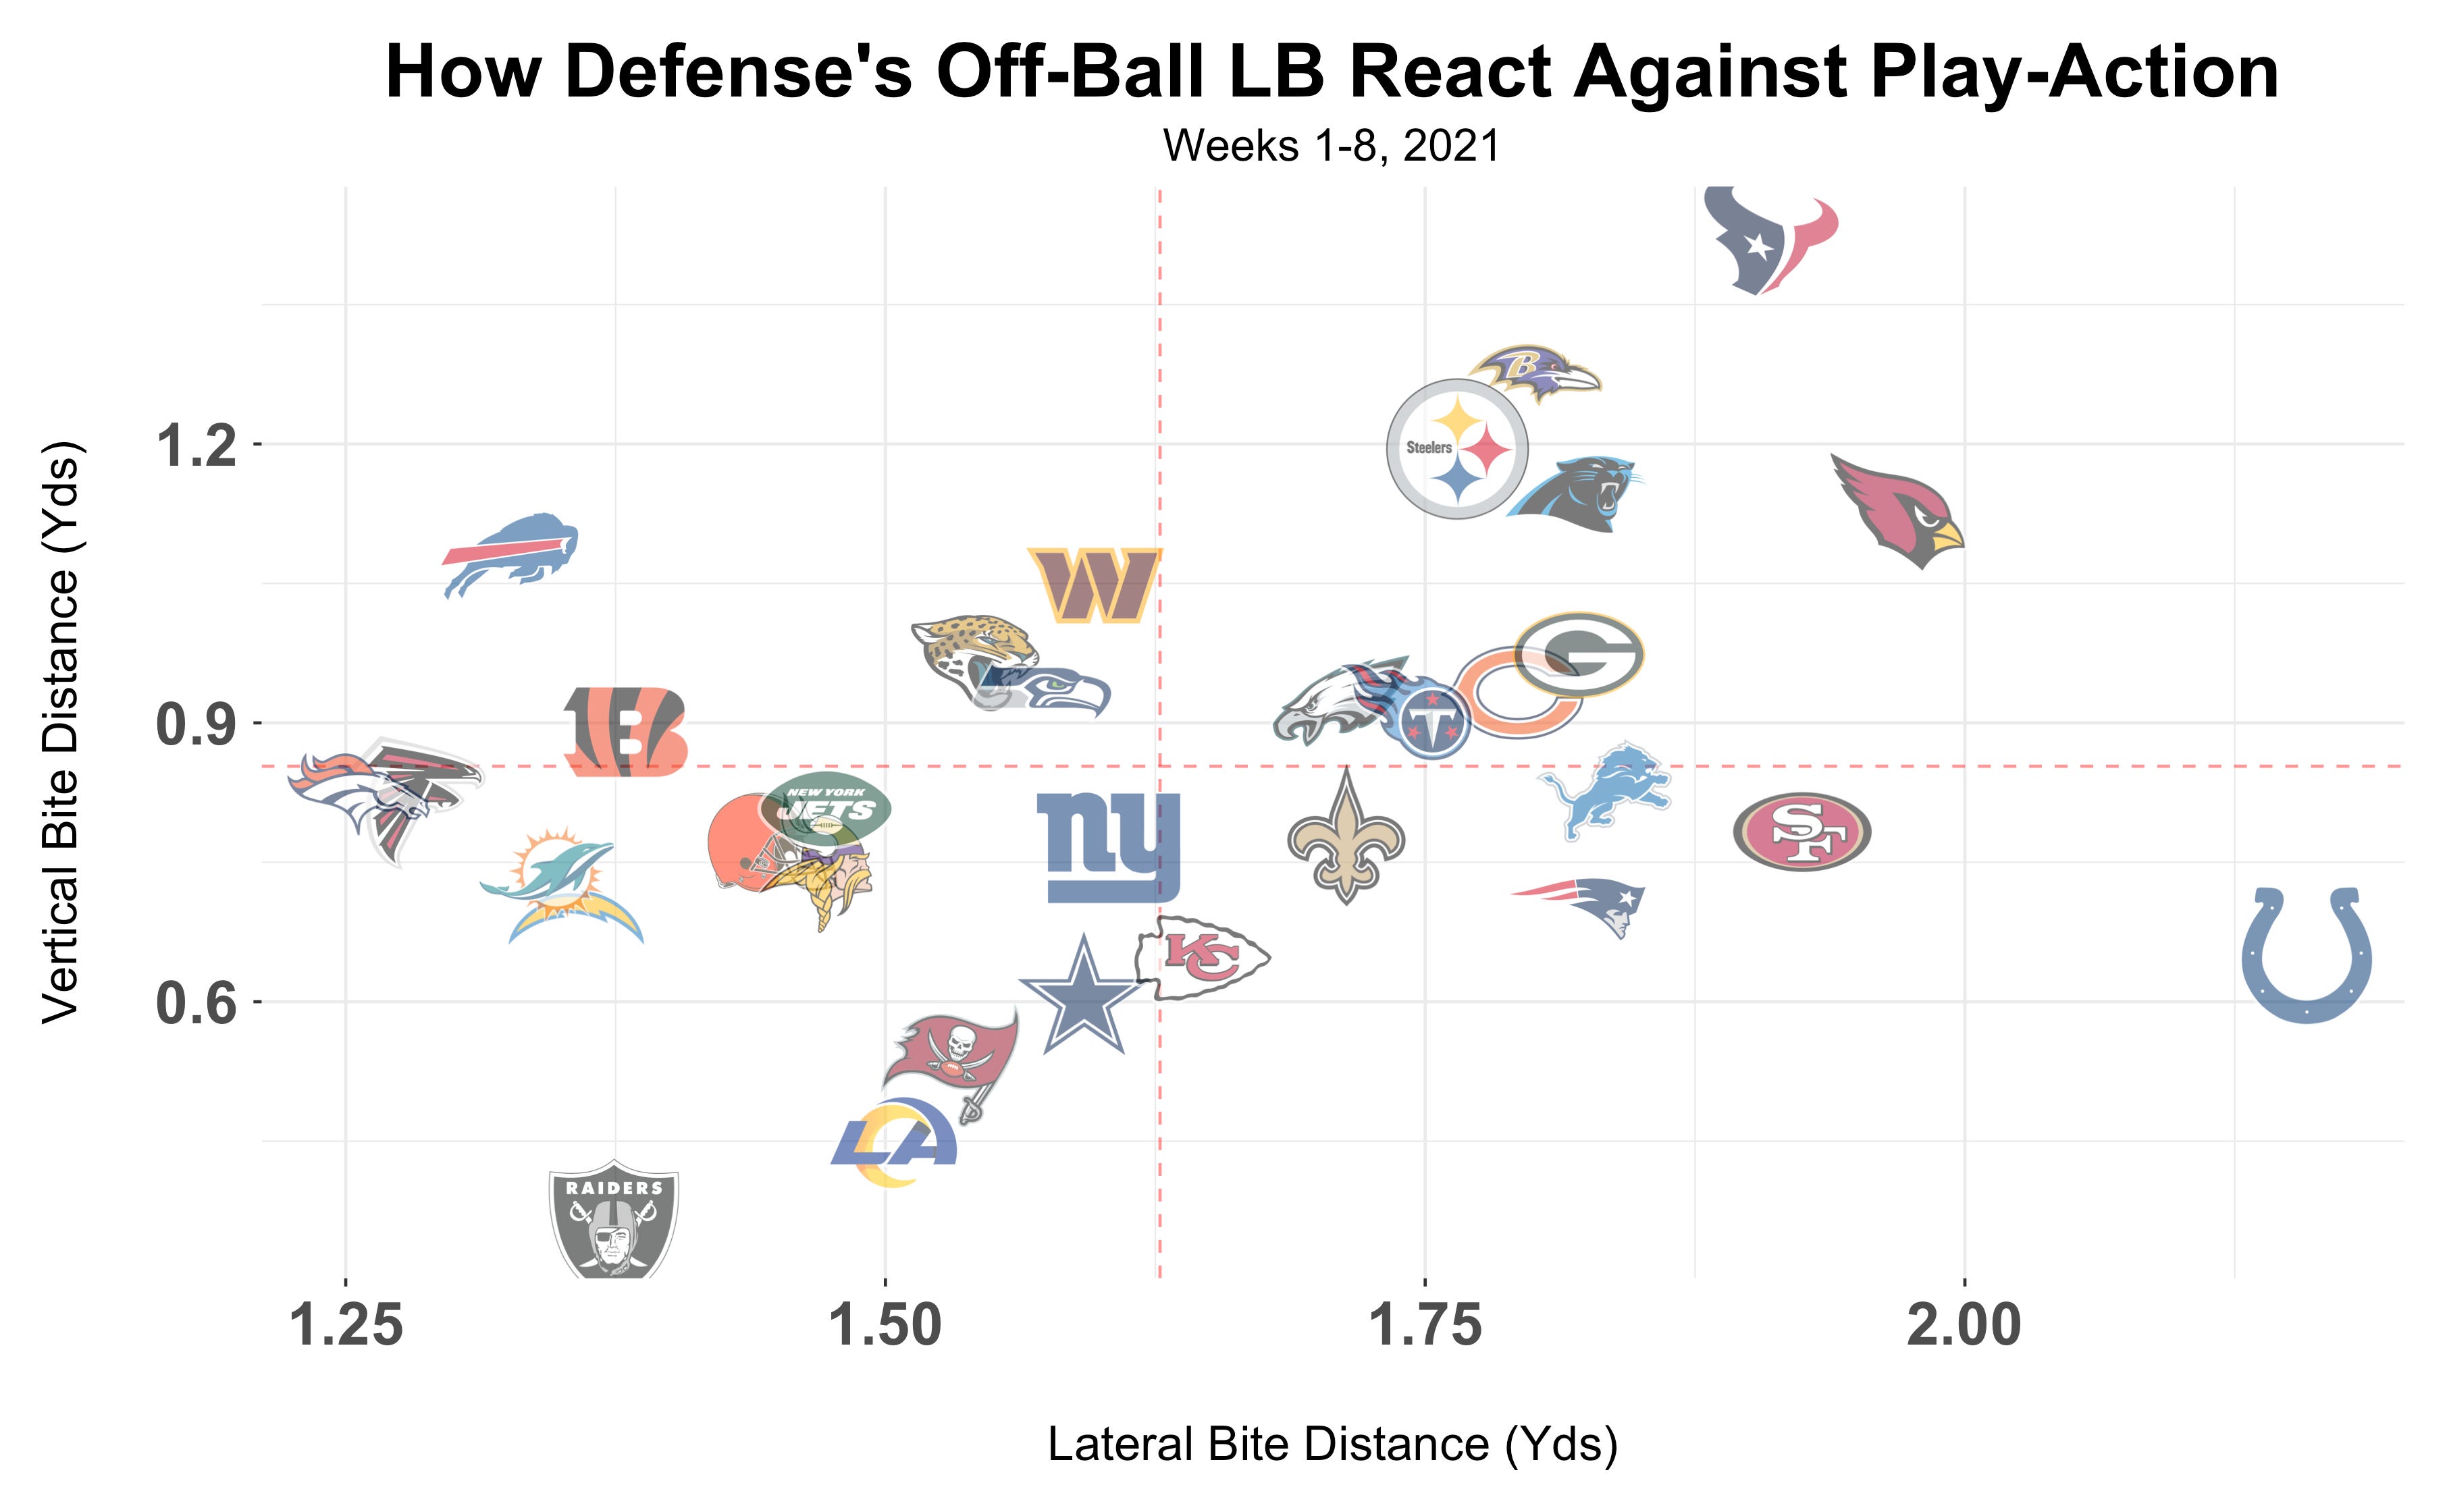
The same quadrant descriptions can be said for the defensive side. The top right are LB corps that struggle to not bite up and are easily moved laterally. The bottom right are teams that bite up less than average, but are still easily moved laterally. The interesting teams here are the Colts and 49ers. Both teams are known for their LB corps.
Shaquille Leonard and Bobby Okereke of the Colts are particularly known for their ability to not bite up on play-action. However, it appears Indianapolis’s LB duo is susceptible to tactics that induce lateral movement (bottom right quadrant in above figure).
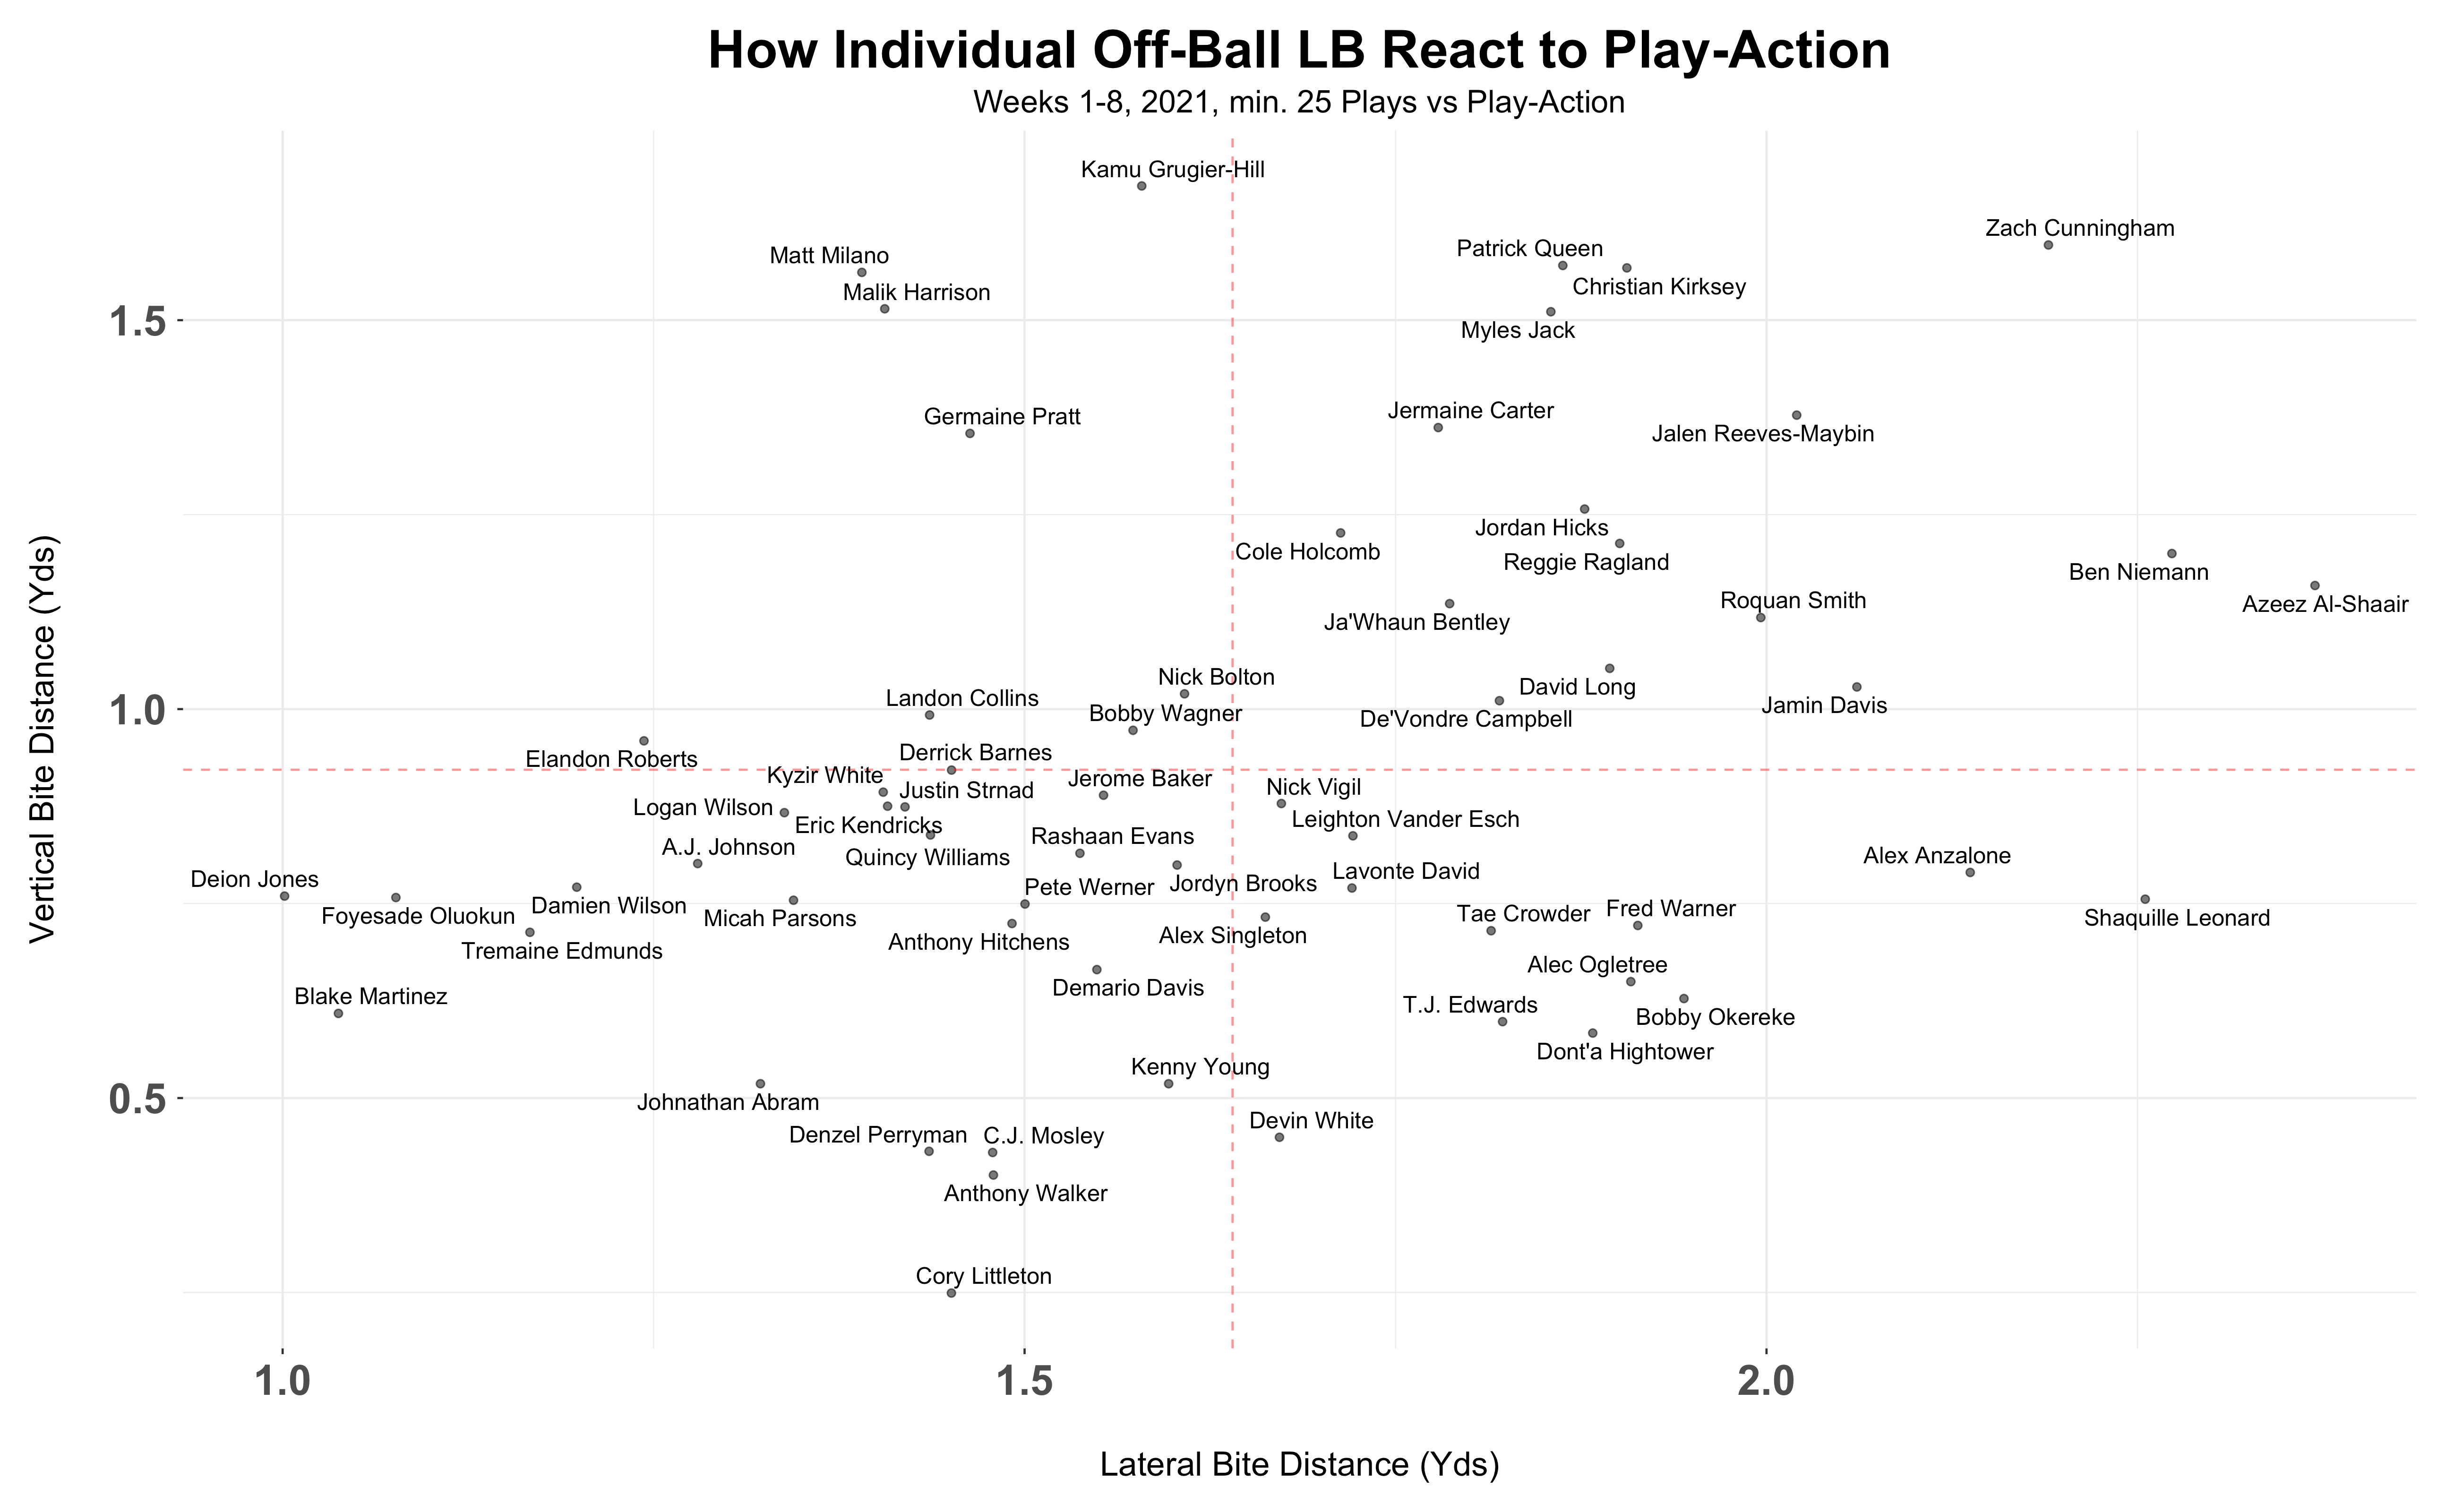
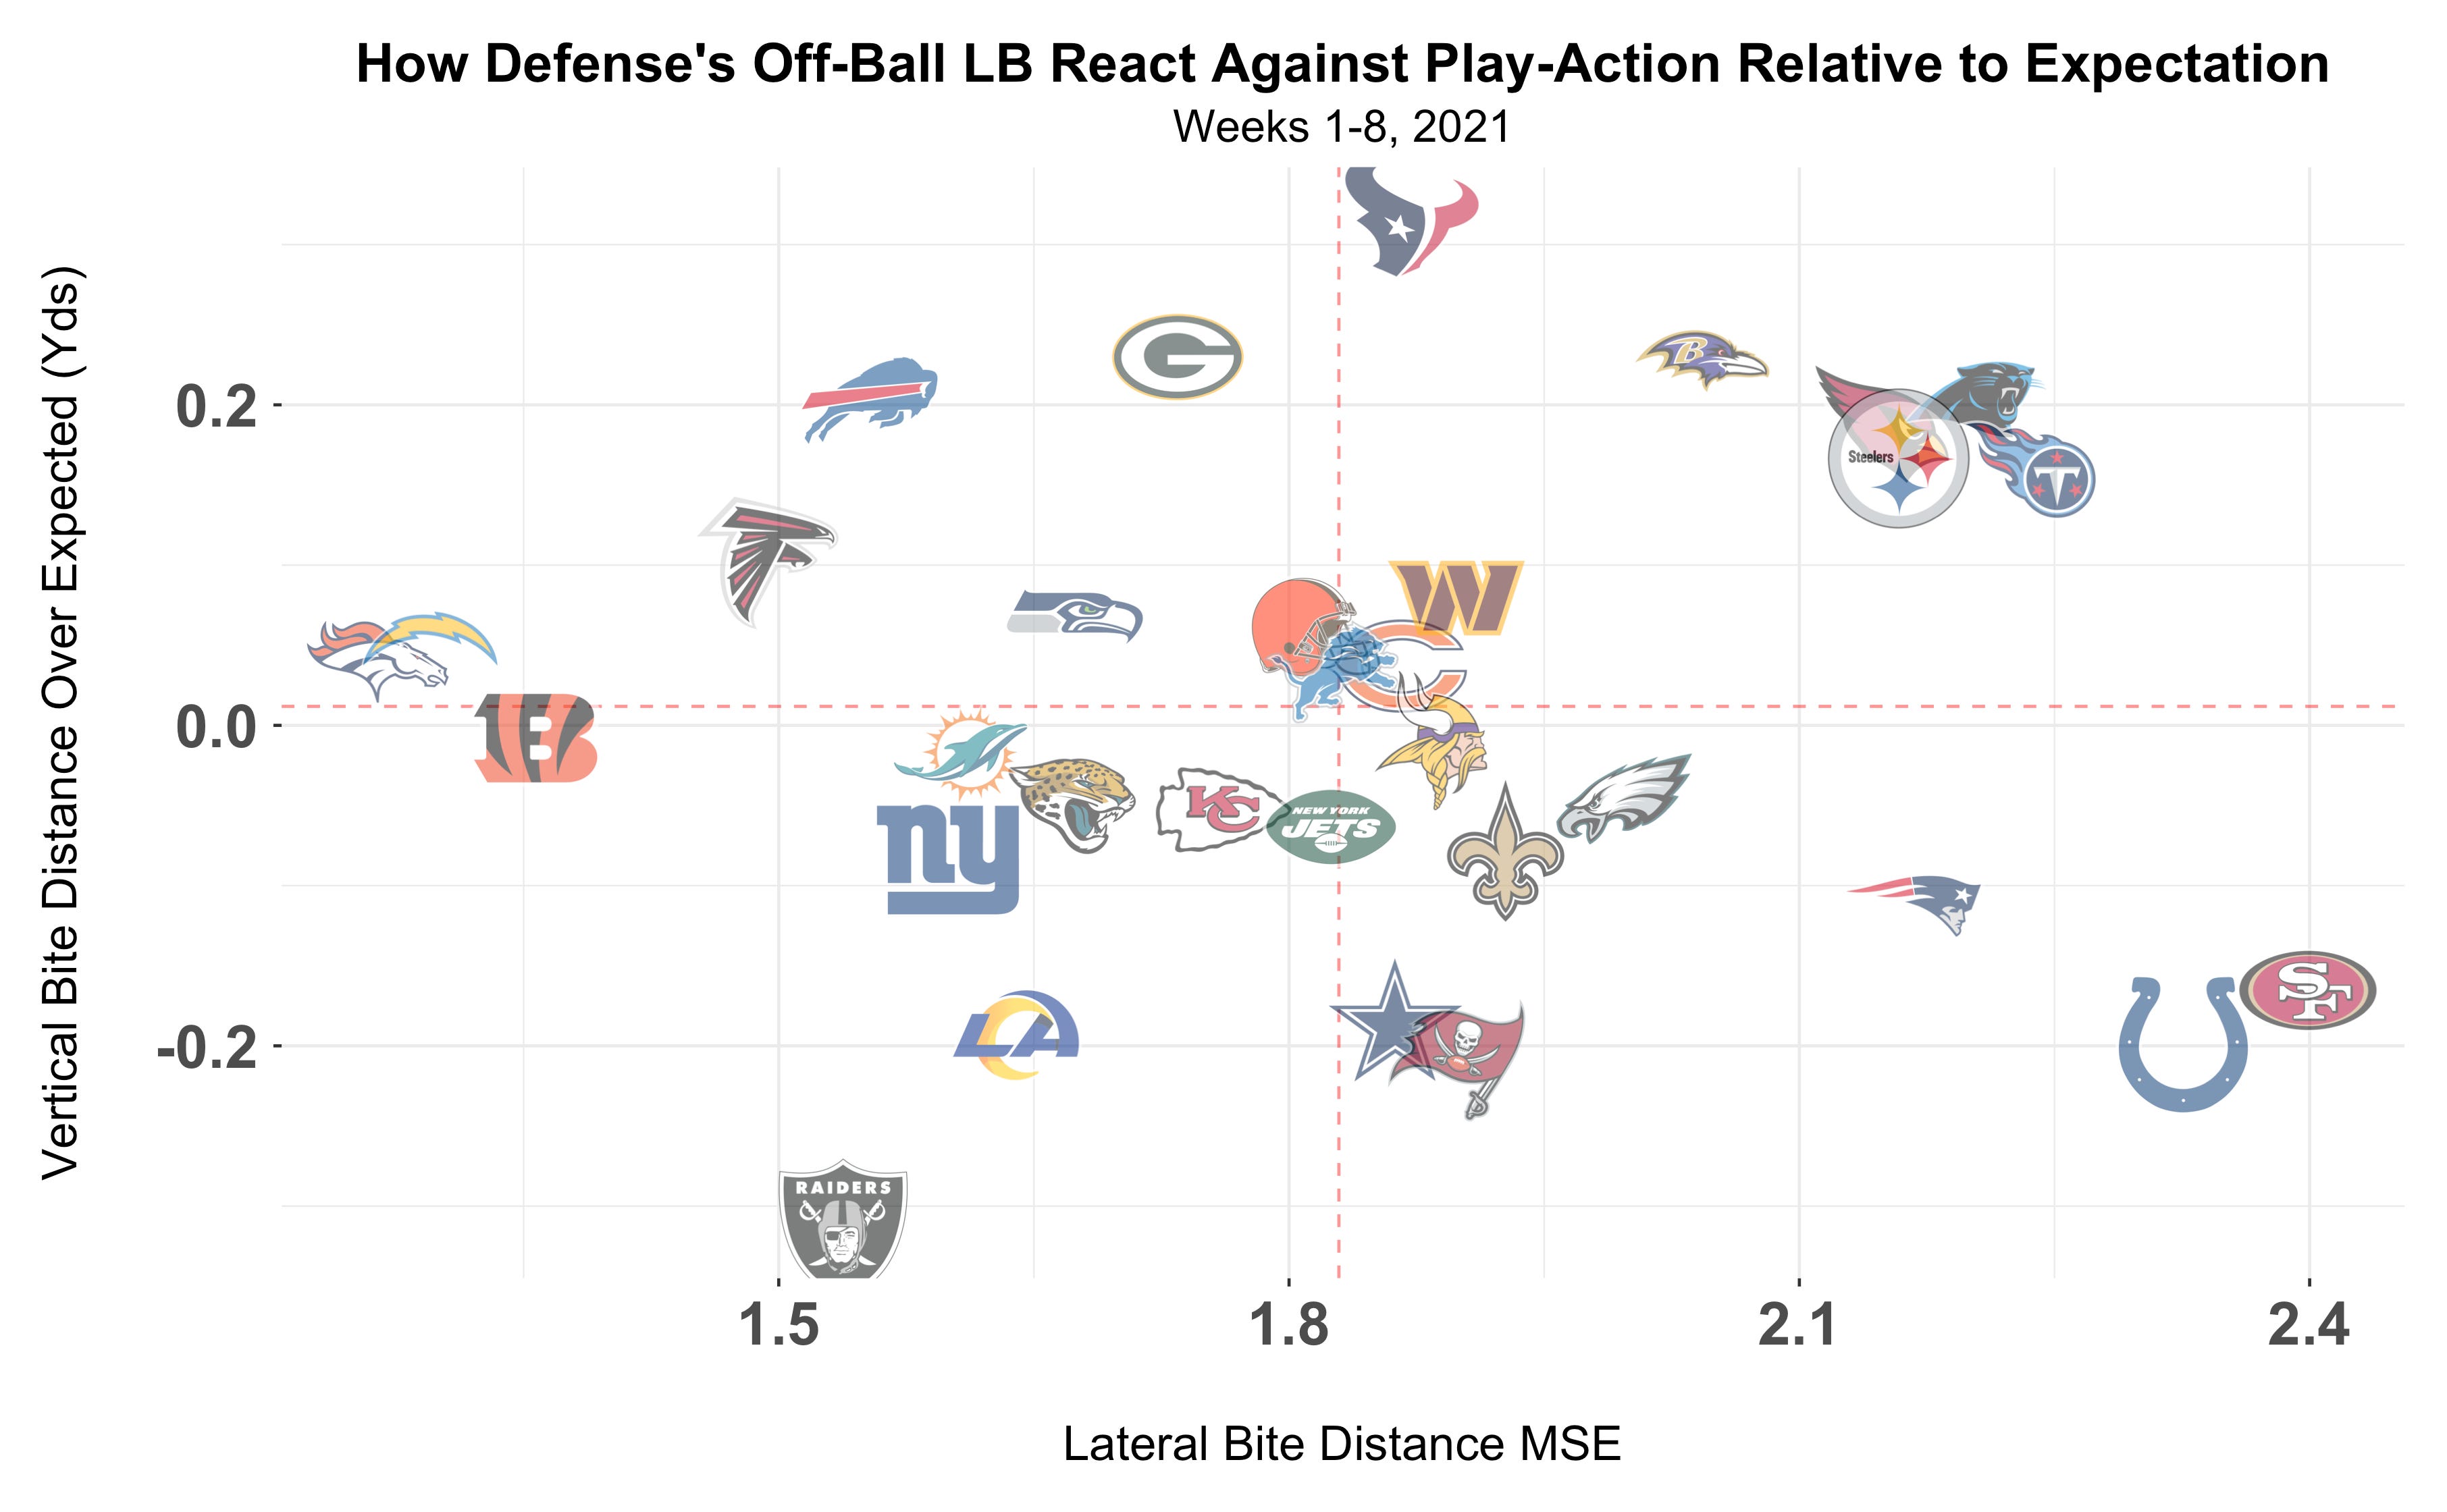
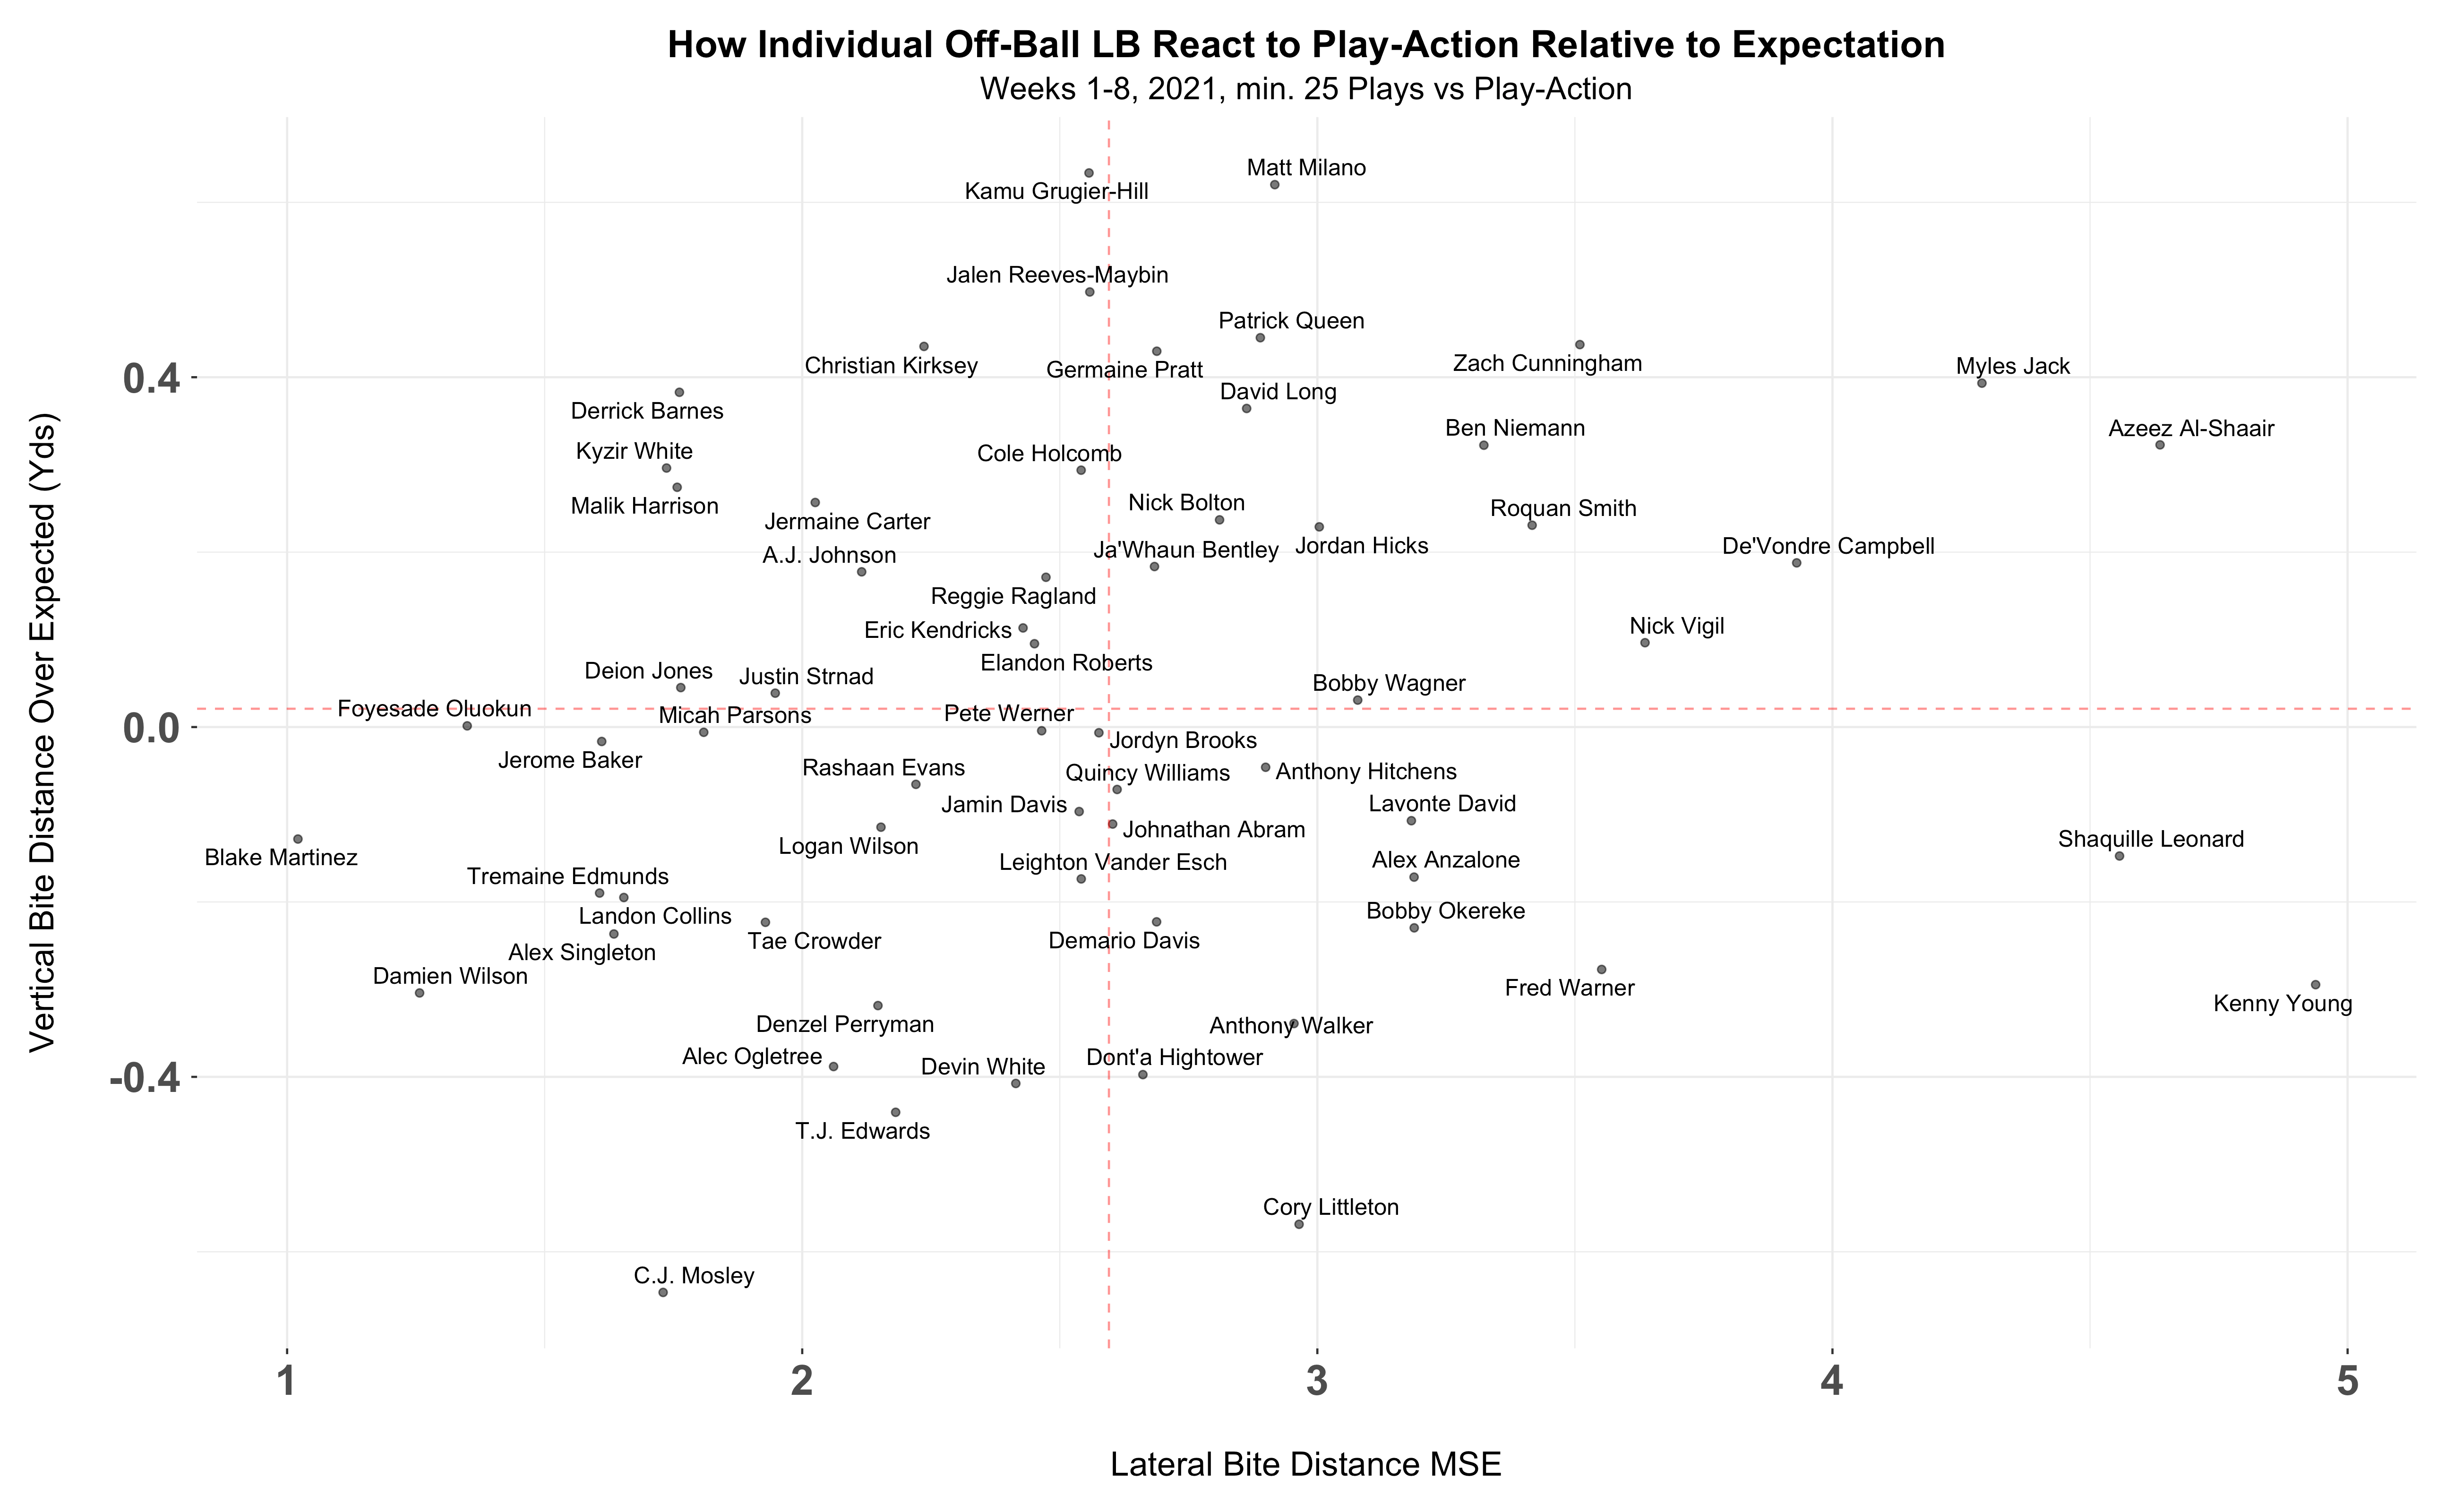
Here are the team LB corps and individual LB scatterplots relative to expectation.
This article serves as an explainer. In the next article I’ll go into how teams can use lateral bite distance for game planning and advance scouting.