Early Returns on the NFL Dynamic Kickoff Rule
I charted each kickoff return from Week 1 of the 2024 preseason - here are the takeaways --- Updates inside


UPDATE: I charted bounces and ball landing yard line for preseason Week 2 to add to the Week 1 data. I may do this throughout the regular season depending on time available. The blocker formation and leverage work is interesting, but teams can use tracking data to pull that. The bounce data might be less calibrated on ball tracking data so charting could be useful here moving forward. I can also rip through a game fairly quickly.
PRE-SEASON WEEK 2
Return or Touchback? (when ball lands in endzone)
Early data signals teams may want to take the free 30 if the ball lands in the endzone. There are edge cases where the returner is on the half yard line from the goal line and the ball is projecting into the endzone but the returner takes it out anyway. It’s a difficult decision in real because you’re risking 10-yards hoping it lands in end zone and a return is getting you to about the 27 each time.
Average starting field position for offenses when ball is returned from end zone: 26.8
land_zone_bins   n     starting_field_pos
15+              2     35.0
6 to 10          32    32.1
inside 5         98    28.3
11 to 15         12    27.3
EZ               27    26.8
Bouncing Line Drive Kicks
We saw more bouncing kickoffs in preseason Week 2 (11) compared to Week 1 (6). Week 2 bounces did not fare as well as Week 1 — averaging a starting field position of 27 in preseason Week 2 compared to 22.8 in preseason Week 1. This can mainly be attributed to the landing yard line of the ball.
The four highest starting field positions on bounces the last two weeks all came in Week 2 (47, 40, 34, and 30) came on kickoffs that landed at the on the 15, 17, 18, and 19, respectively. The sweet spot for bounce kicks seem to be in the 10-12 yard range.
Kickoffs that bounce prior to return average a starting field position of 24.8
Kickoffs caught in the air prior to return average a starting field position of 29.1
Average landing position of bounced ball: 12 yard-line
This does not include dead ball bounces landing outside the 20 yard-line that result in offenses starting at the 40 yard-line
Average Hang Time on bounces: 3.3 seconds
Hang Time - 3.79 seconds on non-bounces | 4.16 seconds for touchbacks
Teams that have used bounces so far - MIA (5), SF (2), Ten tied with (1)
Danny Crossman and the Dolphins are embracing the low trajectory line drive bounce kicks early in the preseason and it’s led to them allowing the lowest average starting field position, excluding penalties, so far this preseason (22.5 average starting field position). They’re also one of two teams to bounce a ball into the endzone for a touchback resulting in a starting field position at the 20 yard-line (SF is the other).
SF may have discovered this by just trying to squib as they performed it with 0:01 remaining in the 1st half.
If I continue this into the regular season I’m going to distinguish between bounces and low trajectory kicks that are caught. Dallas — so far has somewhat of a tendency to try and pin the ball in the left corner inside the 5, but this led to an OOB penalty and they started kicking more towards the middle of field — and Kansas City — the Chiefs leaned into low trajectory line drive kicks but all of them landed inside the 5 or in the endzone — have embraced this strategy in two weeks of preseason action.
Quickest Hang Times (excl. dead ball penalties)
   kick_team     n     hangtime   land_yard_line
 1 LV            9     3.43       2.33
 2 NYG           6     3.43       1.83
 3 KC           11     3.45       3.18
 4 BUF           8     3.46       4.25
 5 MIA           9     3.55       8
 6 LAC           6     3.56       1.83
 7 PIT           5     3.56       4.8
 8 CHI          13     3.56       5
 9 SEA           7     3.57       1.57
10 DAL           9     3.59       1.22
Kicks that are being caught at low trajectories rather than bouncing is a result of the ball traveling further downfield where the returners are aligned. Kicks that bounce typically land before the 10 yard line — see MIA high average land_yard_line relative to the other nine teams on the quickest hang time list.
Meanwhile the Cowboys and Chiefs liners are landing inside the 5. But if KC is any indicator — this strategy can lead to similarly positive results as bouncing the kick — 24.8 average starting field position allowed in Week 2 on such kickoffs, and this is including a low liner that landed in the endzone for a touchback.
I think bounces are more efficient for kickoff units because the kickoff defenders can leave as soon as the ball touches the ground. Additionally the returner has to field a bouncing football which can slow him down and allow the KO unit to get further downfield.
PRE-SEASON WEEK 1
The New Dynamic Kickoff Rules are already making a drastic impact. According to NFL Senior Director of Data & Analytics, Michael Lopez, the preseason Week 1 return rate jumped from 65% in 2023 to 81% in 2024. Additionally the average field position on returns increased from 22.7 in 2023 to 28.5 in 2024.
I charted every kickoff of preseason Week 1 to find additional takeaways in terms of how teams are strategizing with the new rules.
Key Takeaways —
Return or Touchback? (when ball lands in endzone)
Twelve kickoffs were returned from the endzone resulting in an average starting field position at the 27.6 yard-line. It’s just 12 returns and teams might want to test how returning from the endzone impacts the timing and spacing of the play — but early returns show it might cost offenses 3 yards of field position.
land_zone_bins   n     starting_field_pos
6 to 10          23    32.1
inside 5         52    28.5
EZ               12    27.6
11 to 15         6     26.3
It’ll be interesting to see if it’s worth returning balls that bounce into the endzone as more data comes in (teams can either return the ball or down it for possession at the 20 yard-line). My guess is it’ll depend on the positioning of the returner. If the ball bounces in the endzone to him, return it — if it bounces by him, down it.
Bouncing Line Drive Kicks
One strategy kick off units may want to try more often is kicking the ball on a bounce to the returner. Just six of 127 kickoffs resulted in a bounce according to my charting (including penalties other than dead ball bounces), but there is a stark difference in starting field position on these so I felt compelled to share as we might see this tactic used more in the coming weeks.
Kickoffs that bounce prior to return average a starting field position of 22.8
Kickoffs caught in the air prior to return average a starting field position of 29.9
Average landing position of bounced ball: 10.7 yard-line
This does not include dead ball bounces landing outside the 20 yard-line that result in offenses starting at the 40 yard-line
Average Hang Time on bounces: 3.3 seconds
Hang Time - 3.76 seconds on non-bounces | 4.16 seconds for touchbacks
If the ball bounces into the endzone then the return team can return the ball or down it for a possession starting at the 20-yard line. If this trend holds this feels like an advantage for kickoff units with kickers that can place the ball using different trajectories.
Teams that have used bounces so far - MIA (2), LV, DEN, SEA, WAS (1)
The bounce causes the returner to lose time to get upfield as the ball hits the ground — allowing the kicking team to quickly make the tackle. I assume this is why we’ve heard some beat reporters talk about teams doing infield-esque drills with the ball.
To get a sense of some teams that might use this strategy moving forward let’s look at the lowest average hang times of teams with 3+ kickoffs.
Quickest Hang Times (min. 3 kickoffs)
   kick_team     n     hangtime   starting_field_pos landing_yard_line
 1 SEA           3     3.2        34                 2.67
 2 NYG           3     3.23       26.7               1.67
 3 LV            5     3.48       26.6               4.6
 4 DAL           5     3.52       27.6               1.4
 5 DEN           7     3.61       28.9               4
Cool to see Dallas here with John Fassel being one of the advocates for the kickoff rule change. He’s one of the special team coordinators I’d expect to get creative throughout the season.
And here are the teams on the opposite end of the spectrum.
Longest Hang Times (min. 3 kickoffs)
   kick_team     n     hangtime   starting_field_pos landing_yard_line
 1 LAR           4     4.8        30.5              -0.5
 2 SF            3     4.27       41.7               4.33
 3 JAX           5     4.24       31.6               1.8
 4 NYJ           4     4.2        32.2               2.75
 5 ARI           3     4.13       28.7               1.33
Hang times are more of a descriptor for the trajectory of the kick. The time in the air doesn’t matter much when teams have to wait for the ball to be fielded. However, the line drives can create wonky plays and I’ve seen a few dropped as a result. It can create confusion especially among the two returners if one is planning to block. One strategy I might employ with a talented directional kicker is targeting the return man who is further up from the endzone — usually indicating he’s trying to block after the other return fields the ball — and trying to line drive it in his vicinity. I would likely only do this in a true split return man situation (one returner on each side of the field).
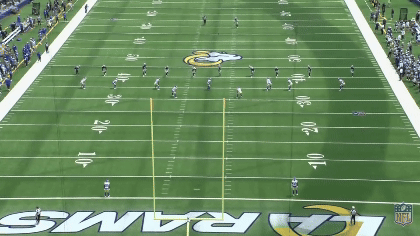
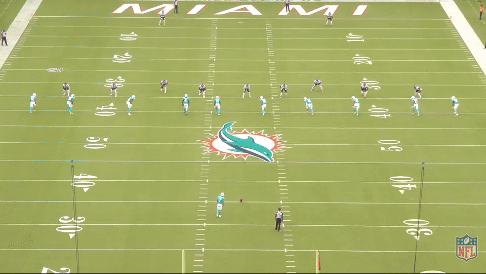
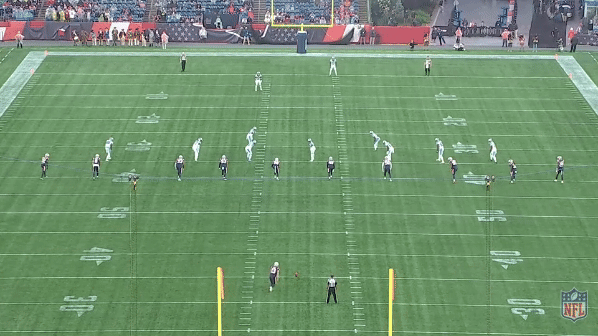
Restraining Line Formation
Return teams must have up to seven players on the “restraining line” and nine total players in the setup zone — the B35 to the B30 yard line. Essentially nine players can align on the restraining line or teams can have one or two players off the line and outside the hashes with up to two returner players.
The three generic formations used were 7-2-2, 9-0-2, and 8-1-2, where the first number is the number of players on the restraining line, the second number the players off the line, but in the setup zone, and the third number the returners.
Return Team Formation Usage - 7-2-2: 77% | 9-0-2: 17% | 8-1-2: 6%
Average Starting Field Position on Returns
7-2-2: 29.7 yard-line
9-0-2: 27.4 yard-line
8-1-2: 29.5 yard-line
Hash Players & Double Teams
One takeaway I’ve concluded through one preseason week of kickoffs is that hash players are important. Particularly how hash players are aligned for leverage purposes and how that impacts the kicking team’s hash players. Early on it appears special teams coordinators feel hash players are important too — of the 39 double teams I charted on returns, 25 of them involved doubling one of the kicking team’s player’s aligned inside the hash (30 of 45 if you include plays with penalties).
Return units that double team one of the hash players on the kick off unit average field position is the 32 yard-line. Double teams on non-hash players (usually the 3rd or 4th player aligned from either sideline) result in a starting field position at the 31 yard-line. While no double teams result in a starting field position at the 27 yard-line.
Starting Field Position -
Double Team on Hash Player - 32.1
Double Team on Non-Hash Player - 31.1
No Double Team - 27.3
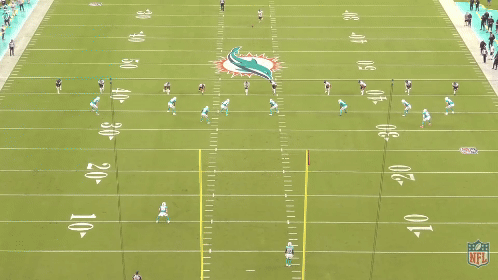
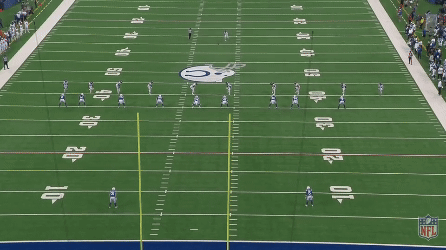
Hash Blockers Leverage & Kick Direction
All directions are from the perspective of the returning team
I categorized hash blocker’s leverages based on their orientation. Below are three examples.


A majority of kickoff utilized Neutral (52) hash blocker leverages followed by Left (30), Split (25), and Right (19) leverages.
One hypothesis I have is that kicking teams can gain an advantage against return teams that show their leverage with their hash players by kicking in the opposite direction. That way the hash players on the kicking team can go against the hash blockers leverage and win more easily down the field. This is somewhat shown in the preseason week 1 data.
For kickoffs where the kick direction goes opposite of the hash blocker’s leverage — on plays where the returning team shows left or right leverage by the hash blockers — the average starting field position is the 25.8 yard-line. Whereas the starting field position for kicking to the leverage is the 29.7 yard-line. This is also without adjusting for where the ball landed. The kicks against leverage landed on the 6 yard-line on average and the kicks with leverage landed on the 4.5 yard-line. So even with a ~1.5-yard head start they’re starting ~4 yards further back when kicking against the hash player’s leverage.
Starting Field Position -
Kicks Against Hash Blocker’s Leverage - 25.8 yard-line | 6.2 landing yard-line
Kicks With Hash Blocker’s Leverage - 29.7 yard-line | 4.5 landing yard-line
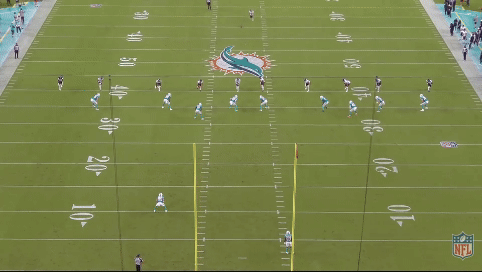
The following play is showing split leverage so this play is not included in the stat above. But MIA is asking the left hash block to reach across to the hash defender aligned in the middle of the field. It’s not an easy task from that alignment and leverage. The middle hash defender easily breaks through the setup zone for a tackle.
MIA would later adjust by shading the left hash blocker more inside to be able to better reach his block. Despite the better positioning the middle hash defender is still able to get by him and get in on the play due to the lack of double team and the kick going opposite of the hash blocker’s leverage.
Other Notes
Returns to the outside are averaging better starting field position than returns to the center of the field
Left/Right: 30.2 (9.6 SD) | Center: 27.6 (6.2 SD)
Return units that “retreat” from the restraining line average fewer yards of starting field position than those that do not
Retreat: 27.2 | No Retreat: 29.4
CAR retreated on all four of their kick returns, but averaged 30.3 average starting field position (5.8 average landing yard-line)
They REALLY retreated compared to other return units
Some kickoff units, like DEN, used “switch” maneuvers to get past blockers (look at the 3rd and 4th furthest players from the right sideline)
LAR used their middle hash blocker in a trap style block (this style block is common for the new kickoff, but I thought how they used was unique)
He shows left side leverage and flips his hips when the ball lands
He travels 15 yards to cut off the left hash defender — feels like a play that’ll be called for many blocks in the back